Group KPI Reporting for Multi-Entity Businesses: The Metrics That Actually Matter
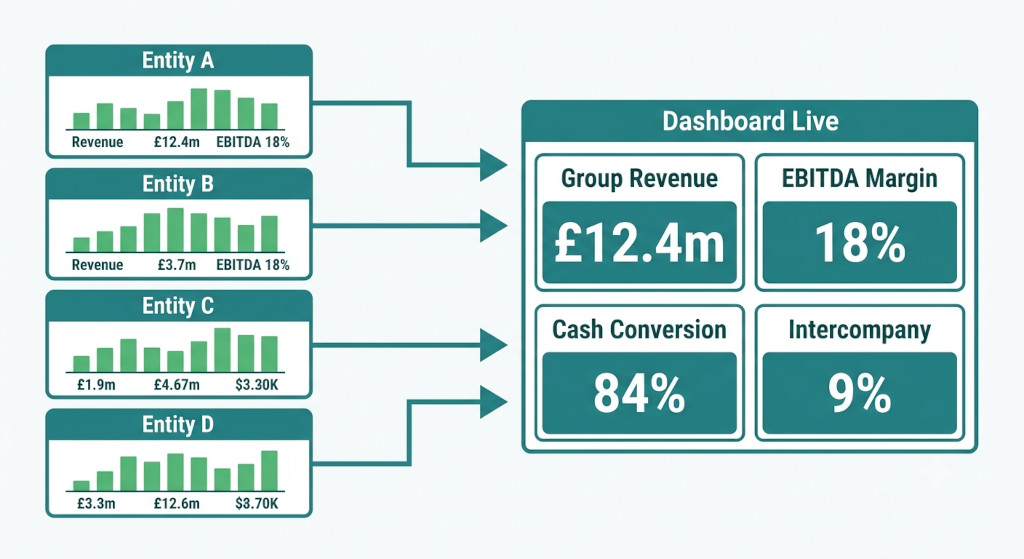
Every subsidiary CFO tracks their own entity’s performance. Revenue against budget, gross margin, overheads, cash position — the standard monthly pack. But when the group CFO sits down to understand how the business as a whole is performing, those entity reports are almost never enough on their own. They need to be consolidated, normalised, and stripped of intercompany noise before any meaningful group KPIs can be calculated.
For most multi-entity businesses, this process is manual: finance pulls trial balances from each entity’s accounting system, pastes them into a master spreadsheet, applies eliminations, and then builds KPI calculations on top. By the time the metrics are ready, the close has already taken a week longer than it should.
Group KPI reporting should be faster, more consistent, and directly connected to the consolidated accounts. This article covers which metrics actually matter at group level, how to structure them across entities, and how finance teams are eliminating the manual assembly work that gets in the way.
Stop building consolidations in spreadsheets.
BrizoConsol automates multi-entity consolidation — setup in minutes, reports the same day.
Why Entity KPIs Don’t Simply Roll Up to Group Level
The most common mistake in group KPI reporting is treating the group as the sum of its entity metrics. Add up each subsidiary’s revenue, average their margins, and call it a day. It sounds logical, but it produces numbers that are wrong in several important ways.
Intercompany transactions inflate both revenue and costs. If Entity A sells £800,000 of management services to Entity B each year, that revenue appears in Entity A’s KPIs and that cost appears in Entity B’s. At the group level, both must be eliminated — otherwise reported group revenue is overstated by £800,000 and the group’s cost structure looks artificially heavy.
Averaging margins ignores the weighting effect of entity size. A high-margin small subsidiary and a low-margin large subsidiary averaged together will produce a group margin figure that understates the drag the large entity creates on overall profitability.
Cash and working capital metrics at entity level reflect intercompany balances. Loans from the parent, amounts due to or from sister entities — these are irrelevant to the group’s actual external liquidity position. The consolidated working capital position, net of intercompany, is the figure that matters.
Meaningful group KPI reporting requires consolidated figures as the starting point: intercompany transactions eliminated, balances reconciled, and a true picture of the group’s relationship with the outside world as the basis for every metric.
The Core Financial KPIs for Multi-Entity Groups
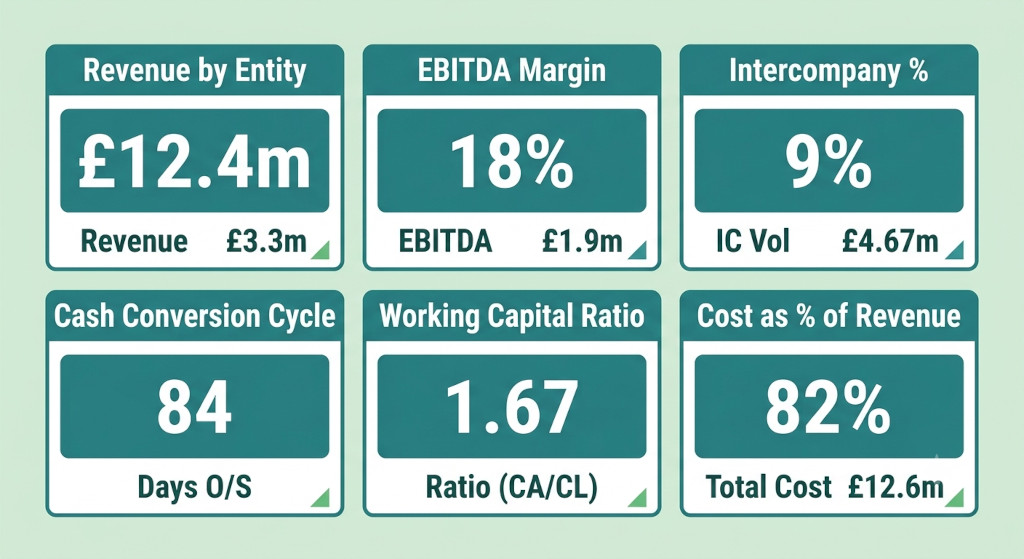
| KPI | What it measures | Why consolidation is required |
|---|---|---|
| Revenue by entity and group | Gross performance per subsidiary vs. true third-party income | Intercompany revenue must be eliminated before group revenue is meaningful |
| EBITDA and EBITDA margin | Operating cash generation at entity and group level | Management fees and recharges distort entity margins without elimination |
| Intercompany revenue as % of total | How much of apparent group revenue is internal | Only calculable once intercompany balances are fully reconciled |
| Cash conversion cycle | Time between paying for inputs and collecting from customers | Intercompany receivables and payables distort entity-level working capital figures |
| Overhead as % of revenue by entity | Overhead efficiency variation across the group | Flags cost misallocation or shared services subsidies that a group P&L alone cannot surface |
The sections below cover each KPI in detail, including how to calculate it from consolidated accounts and what it reveals that entity-level data alone cannot.
Revenue by Entity and as a Group
The most fundamental KPI — but it must be reported two ways. Entity revenue shows the gross performance of each subsidiary before intercompany eliminations. Group consolidated revenue shows what the business actually earns from third-party customers. The gap between the two (the intercompany revenue percentage) is itself a useful metric: a rising intercompany percentage may indicate over-reliance on related-party trading or a structural shift in how the group generates revenue.
EBITDA and EBITDA Margin by Entity and Group
EBITDA (earnings before interest, tax, depreciation and amortisation) is the standard proxy for operating cash generation in multi-entity businesses. At entity level it reveals which subsidiaries are profitable and which are a drain on group resources. At group level it should be calculated from the consolidated P&L — after intercompany eliminations — so that management fees or inter-entity recharges don’t artificially inflate one entity’s profit at the expense of another’s.
Intercompany Revenue as a Percentage of Total Group Revenue
This metric tells the board how much of the group’s apparent revenue is internal. A high intercompany percentage (above 15–20% for most service businesses) warrants scrutiny: are the transfer prices arm’s length? Is the entity structure adding genuine value, or just creating complexity? This KPI is only calculable once intercompany balances are fully reconciled at month-end.
Cash Conversion Cycle
Days sales outstanding (DSO), days payable outstanding (DPO), and days inventory outstanding (DIO) combine to form the cash conversion cycle — the time between paying for inputs and collecting cash from customers. At group level this should exclude intercompany receivables and payables, which distort the picture significantly for groups with large related-party balances.
The consolidated working capital position — net of intercompany — is the metric that external lenders and investors care about. A group whose entity-level DSO looks healthy but whose consolidated DSO is materially higher is carrying more external credit risk than the entity view suggests.
Overhead as a Percentage of Revenue by Entity
Overhead efficiency varies dramatically across entities in the same group. A subsidiary with 40% overhead as a proportion of revenue sitting alongside one at 22% is a signal worth investigating: is the higher-overhead entity over-resourced, or does it carry costs that benefit the whole group (such as shared services, IT infrastructure, or compliance functions)? This KPI drives meaningful management conversations that a consolidated group P&L alone cannot surface.
RetailGroup Holdings: A KPI Pack in Practice
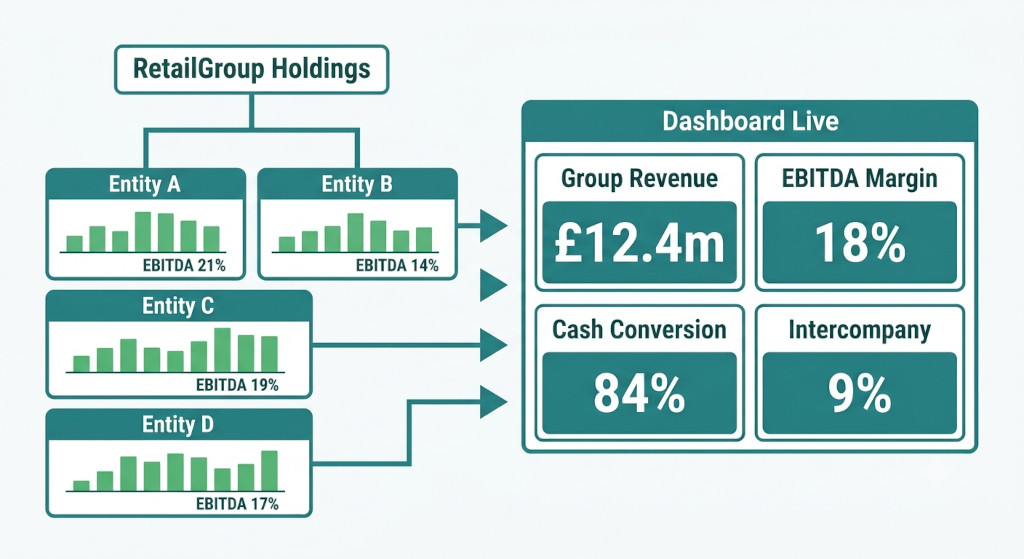
Consider RetailGroup Holdings, a consumer retail business operating four subsidiaries: two physical retail chains, an e-commerce entity, and a logistics company that services all three. All four entities trade with each other — the logistics subsidiary recharges fulfilment costs to the e-commerce entity; the physical retail entities purchase stock through a central buying arrangement managed by the holding company.
The group’s monthly KPI pack is built from consolidated accounts, not entity accounts. Here is what it looks like at a summary level:
| Metric | Retail A | Retail B | E-Commerce | Logistics | Group (Consol.) |
|---|---|---|---|---|---|
| Revenue (£000) | 3,240 | 2,180 | 4,620 | 1,840 | 10,420 |
| Intercompany eliminated | — | — | — | — | (1,460) |
| EBITDA (£000) | 714 | 349 | 832 | 184 | 1,872 |
| EBITDA margin | 22.0% | 16.0% | 18.0% | 10.0% | 17.9% |
| DSO (days) | 18 | 22 | 4 | 31 | 14 |
| Overhead % of revenue | 31% | 38% | 26% | 44% | 32% |
Several things become visible only at this consolidated level. Retail B’s overhead ratio of 38% against a 16% EBITDA margin is a flag — it is the weakest performer by a significant margin, and the board needs to understand whether that overhead includes shared services costs that benefit the broader group, or whether it is genuinely inefficient. The logistics subsidiary’s 44% overhead ratio looks alarming in isolation, but in context it is a cost centre subsidising the group’s fulfilment capability; its “true” contribution is better measured by the cost it saves the e-commerce entity relative to third-party fulfilment rates.
The most useful KPI conversations happen at the intersection of entity and group data — not from looking at each in isolation. A consolidated view without entity drill-down misses the signal; entity data without consolidation contains the noise.
Structuring KPIs Across Reporting Periods
A single month’s KPIs are rarely sufficient for meaningful management decisions. Group KPI reporting typically needs three dimensions of comparison: actual versus budget, actual versus prior year, and current period versus the trailing three or six months. For multi-entity groups this means maintaining a rolling consolidated dataset — not rebuilding it from scratch each month.
This is where manual spreadsheet approaches break down most visibly. Each month’s consolidation requires its own set of eliminations, its own intercompany reconciliation, and its own currency translation (for groups with foreign entities). Storing and comparing these across periods in a spreadsheet is technically possible but practically fragile — any change to the prior month’s model risks breaking historical comparisons.
Finance teams that use dedicated group reporting software for variance analysis maintain a persistent, period-by-period consolidated dataset that updates each month when entities are refreshed. KPI comparisons — actual vs budget, period-on-period, rolling averages — are built on top of that dataset rather than reconstructed manually each time.
Non-Financial KPIs That Belong in the Group Pack
Financial KPIs tell the board what happened. Non-financial KPIs — often called leading indicators — are more predictive of what is about to happen. The most useful for multi-entity businesses are:
Close cycle time — how many days from period end to consolidated accounts; a direct measure of finance team efficiency and data quality
Headcount by entity — a leading indicator of cost growth; rising headcount ahead of revenue is an early warning signal
Revenue per head by entity — a measure of operational leverage; significant variation across entities of the same type warrants investigation
Customer concentration by subsidiary — a risk indicator for businesses with large anchor clients; high concentration in a single entity creates group-level exposure that entity P&Ls alone don’t surface
How BrizoConsol Supports Group KPI Reporting
BrizoConsol connects directly to each entity’s accounting system — Xero, QuickBooks, MYOB, or Zoho Books — and runs the consolidation automatically: intercompany eliminations, currency translation, and chart of accounts mapping all applied without manual intervention. The consolidated P&L and balance sheet that result form the foundation for KPI calculation.
The platform’s custom report builder lets finance teams define KPI formulas once and apply them across every period. Revenue by entity, EBITDA margin, overhead ratios, and working capital metrics can all be configured as named calculations that refresh automatically when entities are updated. The result is a KPI pack that is consistent, period-comparable, and produced without the manual assembly step that currently consumes most of the close cycle.
For boards that need these metrics delivered automatically rather than distributed by email, BrizoConsol’s Insight Packages bundle KPI reports into scheduled, branded packs sent directly to board members, divisional heads, or external stakeholders — without requiring the finance team to manually export, format, and distribute each month.
Conclusion: KPIs Should Be a By-Product of the Close, Not a Separate Project
The reason group KPIs so often arrive late, look inconsistent, or require caveats from the finance team is structural: they are being built on top of a manual consolidation process that was never designed to produce them quickly. When the underlying consolidated data is rebuilt from scratch each month — intercompany eliminations posted manually, currency translation applied in a separate worksheet, entity figures pasted from four different exports — the KPI layer that sits above it inherits every error and every delay.
Getting group KPI reporting right starts one level down: with a consolidation process that is automated, auditable, and consistent across periods. When intercompany transactions are eliminated systematically, when the cash conversion cycle excludes related-party balances by default, and when the period-on-period dataset is persistent rather than rebuilt monthly, the KPIs stop being outputs that require manual assembly and start being outputs that fall naturally out of the close.
Group KPI reporting should be a by-product of the close, not a separate project that follows it. When consolidation is automated and the underlying data is clean, the metrics surface on their own — and the conversations that follow them become better informed, better timed, and more useful to the board as a result.
Build a Group KPI Pack That Updates Itself
BrizoConsol connects to your entities, runs the consolidation automatically, and lets you define KPI calculations that refresh every period — no manual spreadsheet rebuilds required. Start Free Trial