See It in Action
Group Reporting in BrizoConsol
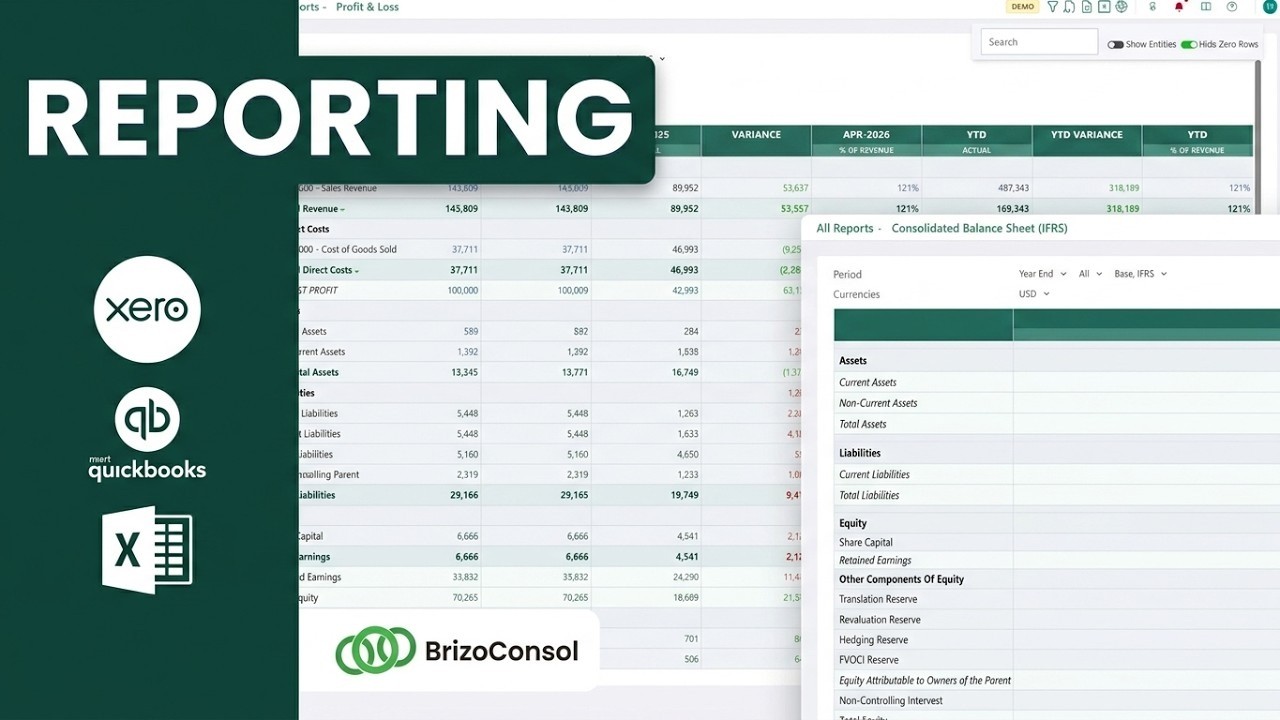
Watch how BrizoConsol produces a consolidated P&L, Balance Sheet, and Cash Flow across all your entities — automatically.
Feature Demo
Group Reporting
Consolidated P&L, Balance Sheet & Cash Flow — Automatically
See how BrizoConsol produces a full set of consolidated financials across all entities — eliminations applied, currencies translated, standards compliant.