Sample Packs
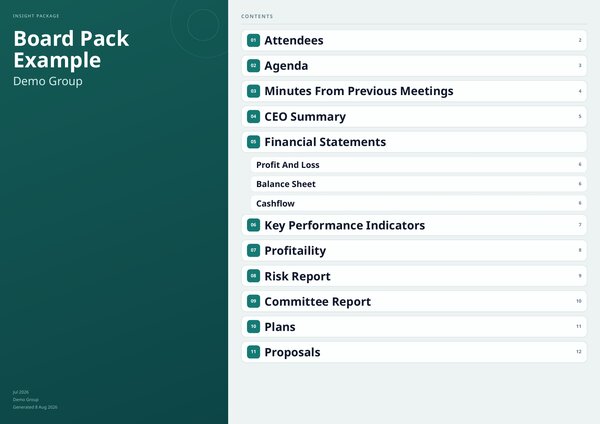
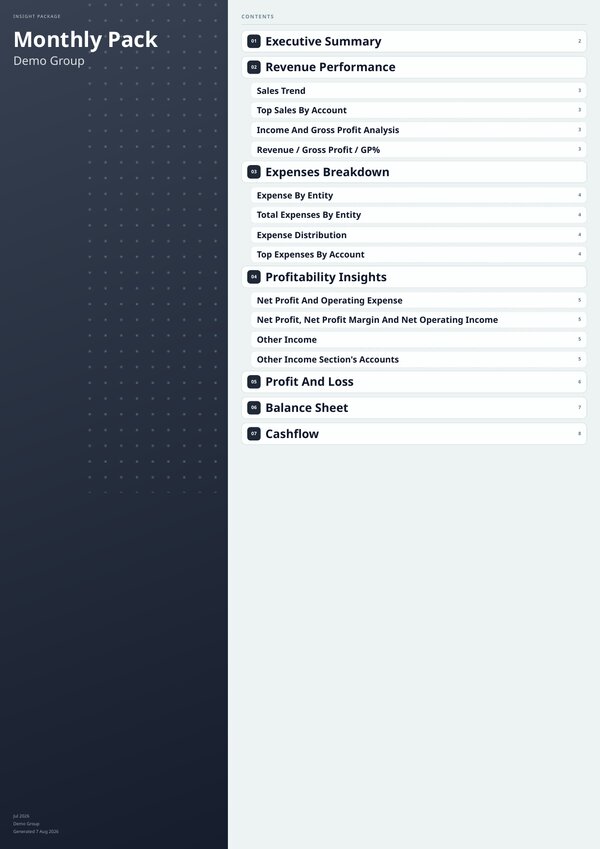
Download Sample Reporting Packs
Explore real examples of monthly reporting and board-ready management packs.
Operational visibility across every entity — consolidated P&L, cash flow by entity, AR aging by customer — updated continuously from your accounting systems. Run the business on current numbers, not last month's spreadsheet.
No credit card required · No onboarding call · Cancel anytime
Board reporting is about governance — quarterly financials for directors. Management reporting is about running the business — weekly and monthly operational numbers for the team making decisions every day. BrizoConsol produces both from the same consolidated data, updated continuously.
Revenue, gross profit, EBITDA, and net profit — at the group level and broken down by entity. See which entities are performing, which are lagging, and where margin is being made or lost.
Group cash position across all entities — where cash came in, where it went, and which entities are cash-positive or cash-constrained. Updated from live accounting data, not month-end snapshots.
AR by customer and entity — 30, 60, 90+ day buckets, AR days trend, and per-customer drill-down. Identify which entities have collection issues before they become cash flow problems.
Customisable KPIs tracked at the group and entity level — gross margin, EBITDA margin, AR days, revenue per entity, cash burn. Set your own targets and see current performance vs target in real time.
An overall group health score — weighted across cash flow, revenue trend, gross margin, and AR days. Catch deterioration early across any entity before it affects the group P&L.
See which entities have closed and which are still open — across the whole group in one view. Track close progress, flag outstanding items, and know exactly when the group consolidation is ready.
Build your own management report cell by cell, with Excel-style formula support. Each cell references live consolidation data — accounts, KPIs, financial statement totals, CTA, NCI, or exchange rates — and recalculates automatically each period.
Upload your own non-financial datasets — headcount, units, customers, or any other driver — with up to three custom dimensions. Use them alongside financial data in dashboards, cell reports, and insight packages to track ratios like revenue per employee or cost per unit.
Add a free-form canvas page to any insight package. Place charts, tables, commentary, and images anywhere — drag, size, and layer them without being constrained to a fixed layout. Use it for custom management packs or narrative pages alongside standard reports.
Each cell holds a live binding, an Excel-compatible formula, or a plain value. The whole report recalculates automatically every period.
Define a dataset — headcount, units, customers, or any operational driver — upload a CSV, and it becomes available alongside financial figures in dashboards, cell reports, and insight packages.
Legal entity structure rarely maps to how management thinks about the business. Virtual Groups let you slice consolidated data by any dimension — brand, geography, product line — without restructuring your entities or chart of accounts.
BrizoConsol pulls data from your accounting systems continuously — not just at month-end. Management dashboards show the latest position, not last month's close. The moment an invoice is raised or a payment is received, the group figures reflect it.
| Entity | Current | 30–60d | 60d+ |
|---|---|---|---|
| HoldCo SG | $142K | $38K | $12K |
| OpCo AU | $218K | $91K | $64K |
| OpCo HK | $87K | $22K | $8K |
| Group Total | $447K | $151K | $84K |
Explore real examples of monthly reporting and board-ready management packs.
Group P&L, cash, AR aging, and KPIs — updated continuously, visible to the whole management team.
No credit card required · No onboarding call · Cancel anytime