When the CFO asks why group revenue is £240,000 below budget, the answer is almost never in the consolidated P&L. It is buried two or three layers down: inside a specific entity, in a specific region, on a specific product line, traceable ultimately to a handful of transactions that did not go as planned. The ability to get from that top-line question to a credible, documented answer — quickly, and without rebuilding the analysis from scratch each time — is the defining test of effective group reporting software.
This article examines why variance analysis is fundamentally harder in multi-entity groups than in single-entity businesses, what a proper drill-down workflow looks like in practice, and how purpose-built financial consolidation software changes the quality and speed of the analysis your finance team can deliver.
Why Variance Analysis Is Harder in Multi-Entity Groups
In a single-entity business, a budget variance can usually be traced to source in a few clicks inside the accounting system. The chart of accounts is consistent, the currency is singular, and the ledger is the same tool the analyst uses daily. The investigation is a matter of filtering and sorting familiar data.
Stop building consolidations in spreadsheets.
BrizoConsol automates multi-entity consolidation — setup in minutes, reports the same day.
In a multi-entity group, each of those assumptions breaks down:
- Different account structures. Each subsidiary may use different account codes, different cost centre hierarchies, and different levels of nominal detail. A variance in the consolidated P&L maps to different accounts in different entities, making like-for-like analysis non-trivial.
- Multiple currencies. A revenue shortfall reported in the group’s sterling P&L might be partly a genuine trading miss and partly a currency translation effect. Without the ability to strip out the foreign exchange impact, it is impossible to tell whether the business underperformed or whether the pound simply strengthened.
- Intercompany noise. Management fees, intragroup recharges, and intercompany loans that have not been fully eliminated can distort entity-level results and make variances appear where none exist — or mask variances that do.
- Data fragmented across systems. If your UK entity is on Xero, your US subsidiary on QuickBooks, and your Australian operation on MYOB, the underlying transaction data lives in three separate platforms with no native cross-system reporting.
The practical consequence is that variance analysis in most multi-entity finance teams is still done in spreadsheets — pulling data from each system, mapping it to a common structure, and building the analysis manually. It is time-consuming, it is fragile, and it means the board gets variance commentary that is already several days old by the time it is finished.
“Our board pack variance commentary was often educated guesswork. We knew the numbers were right, but explaining the drivers meant going back to three different systems and hoping someone had coded everything consistently.” — Group FP&A Manager, consumer goods company, five entities.
What Good Group Reporting Software Must Enable
Effective group reporting software solves the variance analysis problem not by making the analysis easier to do manually, but by eliminating most of the manual work entirely. The following capabilities are the baseline for any platform serious about this use case.
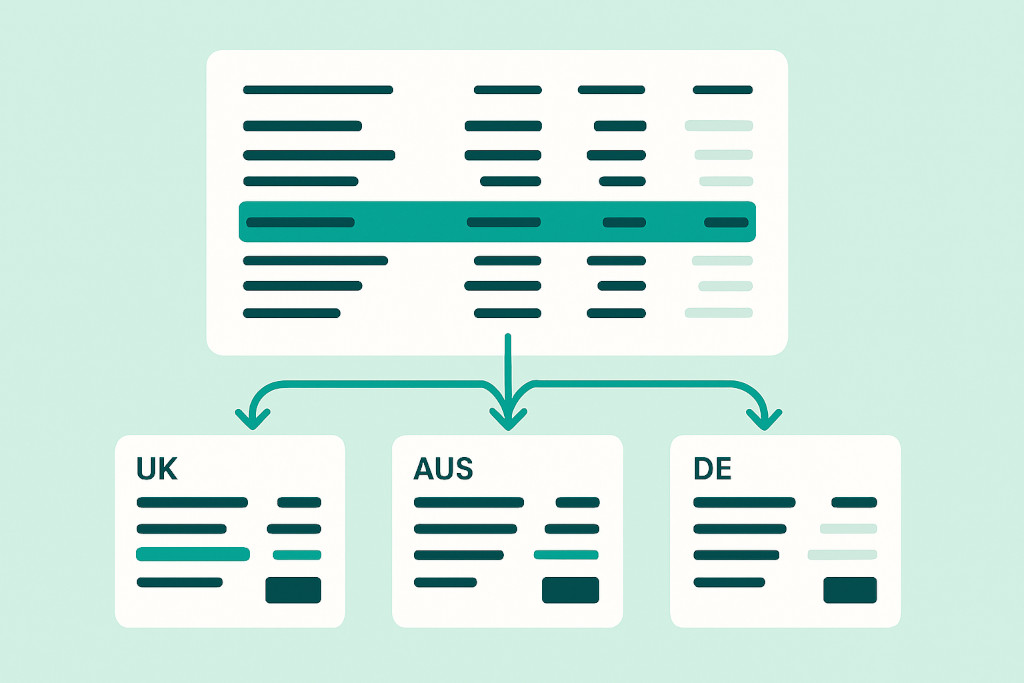
A single consolidated view with entity-level breakdown
The group P&L, Balance Sheet, and Cash Flow should be available in a single interface, with the ability to toggle between consolidated, entity, and segment views without switching tools. Any consolidated line should be expandable to show the contributing figures from each entity.
Consistent account mapping across entities
A maintained mapping between each entity’s native chart of accounts and the group reporting structure is a prerequisite for meaningful variance analysis. Without it, “marketing expense” in one entity and “sales and marketing costs” in another cannot be compared. The mapping must be persistent, version-controlled, and applied automatically on each reporting run.
FX-adjusted variance decomposition
For groups with foreign currency entities, variances should be decomposable into their trading and currency components automatically. The platform should be able to report what revenue would have been at constant exchange rates — separating the business performance story from the FX story.
Drill-through to source transactions
The most important capability: the ability to click on any consolidated figure and trace it back through entity-level data to the originating journal entries in the source accounting system. This is the feature that makes variance explanations credible — not a spreadsheet estimate, but a documented trail to the actual transactions.
Audit trail on all consolidation adjustments
Any consolidation adjustment — elimination entry, currency translation posting, manual journal — should be visible within the drill-down path, clearly labelled as a consolidation entry rather than an entity-level transaction. Auditors and board members alike need confidence that the group figures are the sum of verified entity figures plus documented adjustments, nothing more.
The Drill-Down Workflow: From Group P&L to Source Transaction

In BrizoConsol, the drill-down path from a consolidated variance to its underlying cause follows a consistent, documented sequence. Here is what that workflow looks like in practice when investigating a revenue shortfall.
Consolidated P&L view. The group Revenue line shows £240,000 below budget for the month. The variance is flagged automatically. Click the line to expand by entity.
Entity breakdown. The expansion shows five contributing entities. Four are broadly on budget. The UK entity accounts for £195,000 of the shortfall; the German entity for £45,000. The Australian entity is slightly ahead of budget, partially offsetting. The FX-adjusted view confirms the German shortfall is entirely a translation effect — the EUR business performed to plan.
UK entity detail. Drilling into the UK entity’s revenue breakdown reveals the shortfall is concentrated in one revenue account — “Professional Services Revenue”. All other revenue lines are on or ahead of budget.
Transaction level. The Professional Services Revenue account shows three large invoices that were expected in the period but have not yet been posted — they are visible as open purchase orders or pending invoices in the Xero source data. The shortfall is timing, not a trading loss.
Commentary drafted. The entire investigation — from consolidated variance to documented cause — has taken under fifteen minutes. The board commentary writes itself: £195k UK shortfall is timing on three professional services invoices expected to land in the following week; £45k German shortfall is purely an FX translation effect with no underlying trading variance.
Without financial consolidation software with genuine drill-through capability, the same investigation typically takes a full day — pulling data from Xero, mapping account codes, cross-referencing with budget files, and working backwards through the consolidation spreadsheet to understand what is entity-level and what is a consolidation adjustment.
Common Variance Categories and How to Investigate Each
Structured variance analysis for multi-entity groups typically decomposes variances into four categories. Good group reporting software should support investigation of all four natively.
Volume variance
More or fewer units sold / hours billed / transactions processed than planned. Drill-down to entity revenue accounts and compare against budget quantities. Look for concentrated shortfalls in specific entities or product lines.
Price / rate variance
Revenue or cost per unit differing from budget. Often visible at the account level when volume is broadly on plan but the resulting revenue or cost is not. May reflect discount activity, contract renegotiations, or input cost changes.
Mix variance
The composition of revenue or cost shifting between higher- and lower-margin categories. Requires entity-level account breakdown with margin data. Common in groups with diverse product or service offerings across entities.
FX / translation variance
The impact of exchange rate movements on translated figures. Isolated by comparing actual results at actual rates versus actual results at budget rates. Should always be separated from trading variances in board commentary.
A fifth category — timing variance — cuts across all four above. Revenues or costs expected in one period but recognised in another are among the most common sources of consolidated variances in multi-entity groups, particularly where entities operate in different time zones or have different billing cycles. Drill-through to the transaction level is the only reliable way to identify timing variances with confidence.
Building a Variance Commentary Framework Your Board Will Trust

The quality of board-level variance commentary depends less on the length of the explanation than on its structure and traceability. Finance teams that produce the most effective board packs tend to follow a consistent framework:
Lead with the headline
State the total variance, its direction, and whether it is favourable or adverse. “Group EBITDA for May was £380k, £62k (14%) below budget” — one sentence, no ambiguity. The board reads the headline before the detail; it should be complete enough to stand alone.
Decompose by driver, not by entity
Organising variance commentary by entity (“UK was down £195k, Germany was down £45k”) describes where the variances sit but not why they occurred. Organising by driver (“£195k timing on UK professional services billings; £45k FX translation on German revenue with no underlying trading variance”) gives the board the information they need to form a view.
Separate controllable from structural
FX translation variances, seasonal timing effects, and accounting policy differences between entities are structural — they do not reflect management decisions. Trading variances, margin changes, and cost overruns are controllable. Keeping these categories separate in commentary prevents structural effects from obscuring the signal about business performance.
Link every material variance to a source
Any variance above a materiality threshold should be traceable to a specific account, entity, and — where relevant — transaction. “The £195k shortfall in UK Professional Services Revenue reflects three client invoices (invoice numbers available in drill-down) expected in May but raised in early June” is more useful to a board than “UK revenue timing.”
BrizoConsol’s drill-down capability makes this level of specificity achievable within a normal close cycle. The audit trail on every consolidation adjustment means the commentary is not just credible — it is documented, reproducible, and audit-ready.
How BrizoConsol Supports Drill-Down Group Reporting
BrizoConsol is built on the premise that consolidated figures are only useful if they are explainable. Every number in the group P&L, Balance Sheet, and Cash Flow is backed by a complete chain of provenance: from the consolidated line, through entity-level contributions, through the account mapping, to the source journal entries in Xero, QuickBooks, MYOB, or Zoho Books.
Virtual Groups extend this to any management reporting cut your business requires. If the CFO wants to see variance analysis for the APAC region separately from the EMEA region — even though neither corresponds to a single legal entity — BrizoConsol produces that view from the same underlying data, with the same drill-down capability, without any additional setup.
For groups reporting under IFRS, US GAAP, or UK GAAP, GAAP tagging at the account level means that the same underlying data can support different reporting frameworks for different audiences — statutory consolidation for the auditors, management reporting for the board, and regulatory reporting for any applicable jurisdictions — all from a single consolidation run.
The result is a finance team that spends its time on the analysis that matters — understanding the business, forming views, and advising the board — rather than on the mechanical work of assembling the data in the first place.