Home
Product
How It Works Security AI in BrizoConsol Built on BRIZO
Features
Analysis & Reporting Common Chart of Accounts CTA / FCTR NCI Intercompany Eliminations Step Acquisitions / Partial Disposals Multi-Accounting Standards Month-End Status All Features
Integrations
Xero QuickBooks MYOB Zoho Books Excel Import Other Accounting Software
Solutions
For Accountants CFOs / Finance Leaders Business Owners Multi-Entity Consolidation Multi-Currency Consolidation Group Reporting Board Reporting Management Reporting Pricing See It in Action
Resources
Documentation Tutorials Month-End Guide BRIZO Methodology Webinar Blog
Login Start Free Trial

Build reports around the way your business actually works.

Analyse consolidated financial data, create custom reports, and keep the flexibility of Excel — without rebuilding your reporting process every month.

No credit card required · No onboarding call · Cancel anytime

app.brizoconsol.com · Demo Group · Dashboard
Dashboard
Pulse
Built-in Reports
Row/Column Reports
Consolidation
Journals
Entities
Group Dashboard — Feb 2026 Live · Updated now
Revenue MTD
$4.2M
▲ 14%
Gross Margin
42.9%
▲ 0.8pp
Cash (Group)
$1.2M
Strong
AR Days
38d
⚠ Watch
Revenue by Entity
HoldCo SG$1.8M▲ 12%
OpCo AU$1.4M▲ 18%
OpCo HK$0.7M▲ 4%
OpCo UK$0.3M▼ 2%
Everything you need to analyse, report, and share

Eight purpose-built tools that take your consolidated data from raw numbers to boardroom-ready outputs.

Dashboards

Live KPI panels with charts, scorecards, and trend lines — updated every time you consolidate.

Pulse

A quick-scan health feed that surfaces variances, anomalies, and period-over-period movements automatically.

Built-in Reports

Standard financial statements — P&L, Balance Sheet, Cash Flow — formatted for your accounting standard.

Insight Packages

One-click bundles of charts and commentary your team can share with investors or management.

Cell-Based Reports

An in-app spreadsheet builder. Work on a cell grid with formatting, charts, and conditional formatting — bind any cell to your consolidated data.

Row/Column Reports

A structured composer for standard financial statements. Define typed rows (Section, Account, Formula, KPI) and configure period columns and comparisons.

Custom Dashboards

Build your own views with any metric, any chart type, and any entity combination you need.

Sample Packs

Ready-to-use report templates for common reporting scenarios — hit the ground running on day one.

Live KPIs across every entity, every period

The Dashboard gives your finance team a real-time view of group performance — revenue, gross margin, cash, AR aging, and entity-level breakdowns — updated continuously from your connected accounting systems. No manual refresh, no exports.

  • Revenue, gross margin, and cash KPIs at group and entity level
  • AR aging, expense run rate, and cash trend tracking
  • Month-over-month and year-over-year comparisons built in
  • Drill through from group total to individual entity
Dashboard — Demo Group · Feb 2026
Dashboard
Pulse
Built-in Reports
Row/Column Reports
Group Dashboard ● Live
Revenue MTD
$4.2M
▲ 14% vs last month
Gross Margin
42.9%
▲ 0.8pp vs last month
Entity Breakdown
HoldCo SG$1.8M▲ 12%
OpCo AU$1.4M▲ 18%
OpCo HK$0.7M▲ 4%
OpCo UK$0.3M▼ 2%
Health scores across every entity at a glance

Pulse gives each entity a composite health score based on revenue trajectory, gross margin trend, cash position, and expense run rate. Finance leads can see in one view which entities are on track and which need attention — before the month is over.

  • Composite score per entity updated every consolidation run
  • Revenue trend, margin, cash, and AR components shown separately
  • Flag entities that are off-track before month-end close
  • Historical score trend to track improvement over periods
Pulse — Demo Group · Feb 2026
Dashboard
Pulse
Built-in Reports
Group Health — Pulse Feb 2026
HoldCo SG87
Revenue Margin Cash AR
OpCo AU91
OpCo UK54
Revenue Margin
Consolidated statements — always ready, no assembly required

Built-in Reports give you your P&L, Balance Sheet, and Cash Flow for the group — consolidated, with intercompany eliminations applied and correct accounting standard treatment per entity. Each report is drillable to entity level and traceable to source journal entries.

  • Consolidated P&L, Balance Sheet, and Cash Flow in one place
  • Intercompany eliminations applied automatically every period
  • Drill through from group total to entity to source journal
  • Export to PDF or Excel in one click
Built-in Reports — Demo Group · Consolidated P&L
Dashboard
Pulse
Built-in Reports
Group HoldCo SG OpCo AU OpCo UK
Consolidated P&L — Feb 2026ActualBudgetVar %
Revenue
Sales Revenue4,216,4003,800,000+10.9%
Other Income42,00030,000+40.0%
Total Revenue4,258,4003,830,000+11.2%
Cost of Sales
Direct Costs(2,316,200)(2,090,000)-10.8%
Gross Profit1,942,2001,740,000+11.6%
Gross Margin %45.6%45.4%+0.2pp
Bring supporting information into the reporting workflow

Not all reporting context lives in your accounting system. Insight Packages let you attach Excel workbooks, PDF commentary, or other supporting documents directly to a period — so your analysis and narrative travel with the numbers, not in a separate folder.

  • Upload Excel workbooks and PDF commentary per period
  • Supporting files attached to the relevant consolidation run
  • Accessible to the whole finance team from inside BrizoConsol
  • Keeps analysis and narrative with the numbers, not in separate folders
Insight Packages — Demo Group · Feb 2026
Insight Packages — Feb 2026
📎
Drop files here or click to upload
Excel, PDF, Word — attached to this period
📊
Feb 2026 — Revenue Bridge Analysis.xlsx
Uploaded 3 Mar 2026 · 240 KB
Linked
📄
Feb 2026 — CFO Commentary.pdf
Uploaded 3 Mar 2026 · 85 KB
Linked
📊
Feb 2026 — Expense Breakdown by Entity.xlsx
Uploaded 4 Mar 2026 · 178 KB
Linked
An in-app spreadsheet. Fully yours. Bound to live data.

Cell-Based Reports is an in-app spreadsheet editor — a cell grid where you control every row, column, formula, and format. Bind any cell to your consolidated data so it refreshes automatically each period. Add charts, set conditional formatting, sort, and share — all without leaving BrizoConsol.

  • Free-form cell grid — your layout, your formulas, your groupings
  • Bind any cell to consolidated data — refreshes automatically each period
  • Add embedded charts and conditional formatting rules
  • More flexible than Row/Column Reports for bespoke layouts
app.brizoconsol.com · Group P&L Model · Cell-Based Report
File Home Insert Formulas Data BC ⟳ Refresh
C4 fx =BC.VALUE("Sales Revenue","Group","Feb 2026") ⟳ Live
A B C D E
1 Consolidated P&L — Group
2 Account Jan 2026 Feb 2026 Mar 2026 YTD
3 Revenue
4 Sales Revenue 3,814,200 4,216,400 8,030,600
5 Other Income 28,500 42,000 70,500
6 Total Revenue 3,842,700 4,258,400 8,101,100
7 Cost of Sales
8 Direct Costs (2,108,100) (2,316,200) (4,424,300)
9 Gross Profit 1,734,600 1,942,200 3,676,800
Linked to BrizoConsol — refreshes each period Group P&L HoldCo SG OpCo AU
Build structured financial reports row by row, column by column

Row/Column Reports is BrizoConsol's structured report composer for standard financial statements. You define each row by type — Section, Account, Formula, Label, KPI, By Entity, or Additional Data — then configure which period columns to show. Recommended for P&Ls, balance sheets, and management reports that follow a consistent structure.

  • 7 row types: Section, Account, Formula, Label, KPI, By Entity, Additional Data
  • Column periods: fiscal year, rolling windows, or custom ranges
  • Comparison columns: Actual vs Budget, Actual vs Last Year, Actual vs Forecast
  • Save once — reruns automatically on every consolidation
Row/Column Reports — Group P&L
Group P&L · Columns: Feb 2026 · Jan 2026 · YTD + Add Row Export
Type Description Feb 2026 Jan 2026 YTD
SECTION Income
FORMULA Gross Profit = Revenue − Cost of Sales 2,618,200 2,324,100 4,942,300
SECTION Operating Expenses
+ Add Row  ·  choose Section · Account · Formula · Label
Slice the data any way the business needs it

Custom Dashboards let you analyse consolidated data across any dimension — group vs entity, account level, trend over time, or custom groupings like brand, region, or division. Build the view once; it stays current every period without any manual work.

  • Group vs entity vs account-level analysis in one place
  • Trend and period comparison across any date range
  • Virtual Group dimensions: brand, region, division — without restructuring entities
  • Share dashboards with management — controlled access per entity
Custom Dashboard — Revenue Trends
Group By Entity By Region By Brand
Monthly Revenue — Group Last 7 months
Aug
$3.4M
Sep
$3.6M
Oct
$3.5M
Nov
$3.8M
Dec
$3.9M
Jan
$3.8M
Feb
$4.3M
HoldCo SG$1.8M42%
OpCo AU$1.4M33%
OpCo HK$0.7M16%
OpCo UK$0.3M7%
Download Sample Reporting Packs

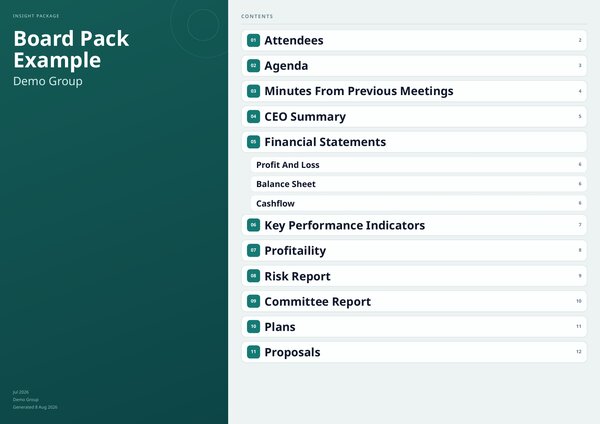
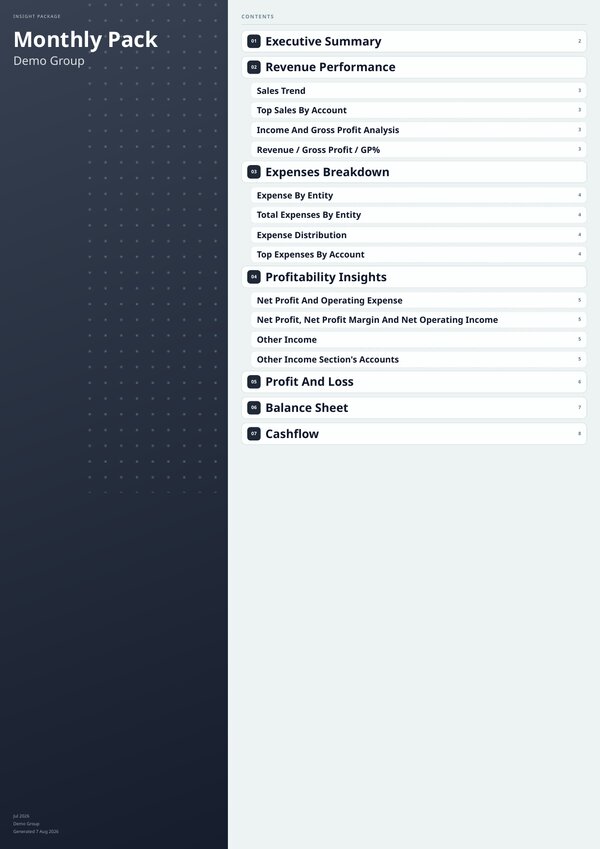
Explore real examples of monthly reporting and board-ready management packs produced with BrizoConsol.

Common Questions
Can I use BrizoConsol reports without setting up all entities first?
No — reports are generated from your consolidated data, so at least one entity and one consolidation run are needed before any output is available. The good news is that BrizoConsol's guided setup gets you to your first consolidation in under an hour.
Do the Cell-Based Reports work with any version of Excel?
They work with Excel 2016 and later on both Windows and macOS, as well as Microsoft 365. The BrizoConsol add-in handles the connection; no manual API calls or macros are needed.
Which accounting standards are supported for financial reports?
Reports support IFRS, AASB, US GAAP, UK GAAP (FRS 102), SFRS, and Local GAAP. You configure the standard at the consolidation group level, and all statement layouts and disclosure logic adjust accordingly.
Can I share dashboards and reports with people who don't have a BrizoConsol login?
Yes. Insight Packages can be exported as PDF or shared via a read-only link with optional password protection. Dashboards can also be embedded into internal portals using the iframe embed option.
How often do dashboards and Pulse data update?
Dashboards and Pulse reflect the latest completed consolidation run. You can re-consolidate as often as needed — there is no limit on consolidation frequency — so your reports are always as current as your last run.
Can I build a report that shows entities in different currencies side by side?
Yes. BrizoConsol handles currency translation as part of consolidation, so your reports can display each entity in its functional currency, the group presentation currency, or both — controllable at the report level.
Are Sample Packs templates I can customise, or just reference documents?
They are working templates. Once downloaded, you can open a Sample Pack in Row/Column Reports and adapt the row structure — sections, accounts, formulas — and period columns to match your own group.

Start reporting on your business the way it actually works.

Dashboards, Pulse, Cell-Based Reports, and Row/Column Reports — all included. Explore with demo data in minutes.
Start Free Trial See It in Action
No credit card required · No onboarding call · Cancel anytime