Build an IFRS 18 P&L in a BrizoConsol Cell-Based Report
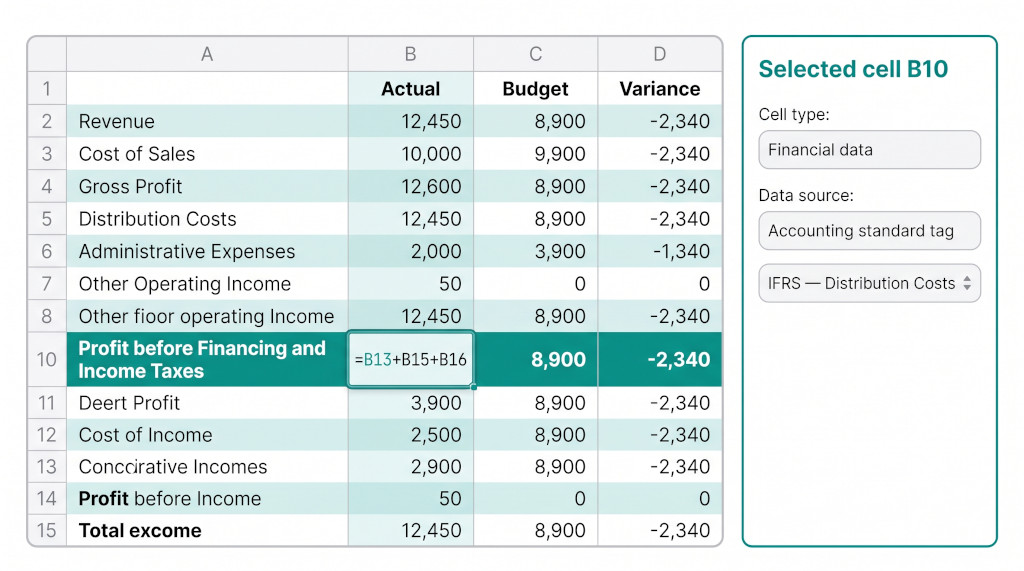
Most finance teams already have an IFRS 18 income statement in BrizoConsol: the system Consolidated Profit and Loss (IFRS) report carries the new Profit before Financing and Income Taxes subtotal. The request that follows is predictable. The board pack wants the same statement with a Budget column beside Actual and a variance next to it, a layout the CFO has used for years, and a file that can go out as Excel with the arithmetic still visible.
That is a spreadsheet job, and until now it usually ended in a spreadsheet: export the statement, paste it into a template, retype the subtotals, repeat next month. The cell-based report in BrizoConsol removes the export-and-paste step. Every cell is either text, a formula, or a live read from the consolidation. With this release, a cell can also read an accounting standard tag directly — the same IFRS classification the system statement uses for Distribution Costs, Administrative Expenses and Share of Profit of Associates.
This post builds the IFRS 18 statement from a blank cell-based report, cell by cell, and adds a Budget and Variance column.
Stop building consolidations in spreadsheets.
BrizoConsol automates multi-entity consolidation — setup in minutes, reports the same day.
What is new: the Accounting standard tag data source
On the Accounting Standard screen, each account can carry a tag per standard — for example, the IFRS tag Distribution Costs or Share of Profit of Associates. The IFRS P&L uses these tags to collect lines that don’t map to a single account type. Before this release, a cell-based report could read accounts, sections, account types and statement totals, but not those tags.
A Financial data cell now has a data source called Accounting standard tag. Three details matter for how it behaves:
- The picker lists only the standards your organisation reports under. A group reporting under Base and IFRS sees entries such as IFRS — Distribution Costs and IFRS — Share Capital. US GAAP or UK GAAP tags don’t appear unless those standards are switched on, because accounts are only tagged for the standards they’re presented in.
- A tag reads a group of accounts. The cell adds up every account mapped to that tag. Its total is the figure the IFRS statement shows for the same tagged line, not the balance of any single account.
- The tag sets the starting basis. Picking a profit-and-loss or cash-flow tag sets Value to Monthly movement. Picking an equity or balance-sheet tag sets it to Closing balance. You can still change it.
Start a blank cell-based report
From Custom Reports, add a report and choose Cell-based report in the report-type dialog. The editor opens on an empty grid with an inspector panel beside it. Select any cell and the inspector shows its coordinate and a Cell type control. These are the types this build uses:
| Cell type | Used here for |
|---|---|
| Text or number | Title, row labels, the column headers Actual and Budget |
| Financial data | Every figure read from the consolidation |
| Formula | Every subtotal, the reclassified lines and the variance column |
Formula cells are calculated with Excel’s own function set, so SUM, IF and IFERROR behave the way your team expects. In a formula cell, the inspector’s Formula helper lets you search for a function by what it does. Once a formula starts with =, clicking a cell or dragging across a range drops the reference into the formula.
The layout
The statement goes in rows 6 to 24. The source lines that only feed formulas — raw Other Income, Interest Income, Finance Income and Finance Costs by type, Expense, Depreciation and Interest Expense — sit in a helper block in rows 26 to 32, which you hide later. This is the main structural difference from a row/column report: a formula can point at any cell, so helper figures don’t need to sit between the lines they feed.
| Cell | Column A label | Column B (Actual) |
|---|---|---|
| A1 | Consolidated Statement of Profit or Loss (IFRS 18) | — |
| B5 / C5 / D5 | — | Text: Actual / Budget / Variance |
| 6 | Revenue | Financial data · System account type · REVENUE |
| 7 | Cost of Revenue | Financial data · System account type · DIRECT COSTS |
| 8 | Gross Profit | =B6-B7 |
| 9 | Other Income | =B26-B28-B16 |
| 10 | Distribution Costs | Financial data · Accounting standard tag · IFRS — Distribution Costs |
| 11 | Administrative Expenses | Financial data · Accounting standard tag · IFRS — Administrative Expenses |
| 12 | Other Operating Expenses | =B29+B30-B10-B11 |
| 13 | Operating Profit | =B8+B9-B10-B11-B12 |
| 15 | Finance Income | =B28+B27 |
| 16 | Share of Profit of Associates | Financial data · Accounting standard tag · IFRS — Share of Profit of Associates |
| 17 | Profit before Financing and Income Taxes | =B13+B15+B16 |
| 18 | Finance Costs | =B31+B32 |
| 19 | Profit Before Tax | =B17-B18 |
| 20 | Income Tax Expense | Financial data · System account type · TAXES EXPENSE |
| 21 | Profit for the Year | =B19-B20 |
| 22 | Attributable to: | — |
| 23 | Owners of the Parent | =B21-B24 |
| 24 | Non-Controlling Interests | Financial data · Account type total · NCI ALLOCATION |
| 26 | Other Income (raw) | Financial data · System account type · OTHER INCOME |
| 27 | Interest Income | Financial data · System account type · INTEREST INCOME |
| 28 | Finance Income (by type) | Financial data · Account type total · FINANCE INCOME |
| 29 | Expense | Financial data · System account type · EXPENSE |
| 30 | Depreciation | Financial data · System account type · DEPRECIATION |
| 31 | Finance Costs (by type) | Financial data · Account type total · FINANCE COSTS |
| 32 | Interest Expense | Financial data · System account type · INTEREST EXPENSE |
The formulas follow the system IFRS P&L line for line. Other Income has Finance Income and the share of associates taken out, because IFRS 18 presents those in the investing category below Operating Profit. Other Operating Expenses is total expense and depreciation less the two tagged lines, so no cost is counted twice. Interest Income moves into Finance Income.
Share of Profit of Associates is read once, in B16, and used twice: as its own visible line and as a deduction inside Other Income in B9. In a cell-based report, a figure doesn’t need a hidden duplicate to be used in another calculation.
Bind a cell to an accounting standard tag
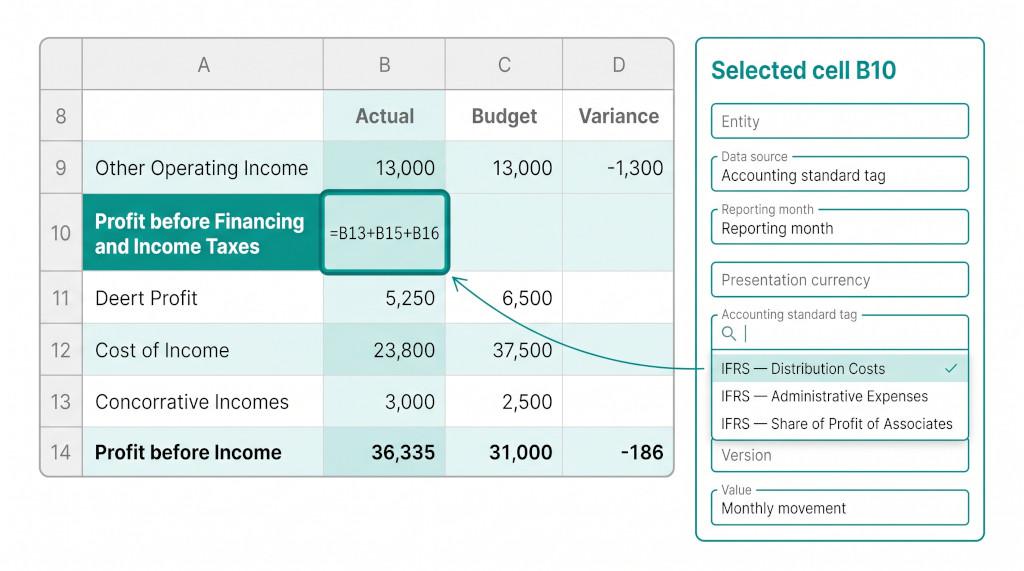
Take B10, Distribution Costs. Select the cell, set Cell type to Financial data, and the inspector shows the binding fields in this order:
- Entity — leave it on Current entity to read the consolidated group.
- Data source — choose Accounting standard tag.
- Reporting month — leave it on Reporting month, so the cell reads whichever month the report is run for. The other options are Fixed month and Link to a cell.
- Presentation currency — the group’s presentation currency.
- Accounting standard tag — search for and pick IFRS — Distribution Costs. Value switches to Monthly movement because this is a P&L tag.
- Version — Actual for now. The next section changes this.
The cell resolves straight away in the editor’s preview. Repeat this for B11 (IFRS — Administrative Expenses) and B16 (IFRS — Share of Profit of Associates). The other financial cells use System account type or Account type total as their data source, set the same way.
See a cell-based IFRS 18 statement built live
We’ll build it on your own chart of accounts and show the tag bindings resolving against your IFRS mapping. See It In Action
Add Budget and Variance with one fill
Each binding field that shows a Cell reference checkbox can take its value from another cell. Version is one of those fields. In every financial cell in column B, tick Cell reference next to Version and enter B5, the cell containing the text Actual.
Select B6:B32 and fill right into column C. Copying a cell in BrizoConsol shifts its references the way Excel shifts a relative reference. Each copied formula follows its own column, so =B6-B7 becomes =C6-C7. Each copied binding does the same: its Version reference moves from B5 to C5. Type Budget in C5, and every financial cell in column C reads the Budget version. Column C needs no further setup.
For the variance, enter =B6-C6 in D6 and fill down through D24. Delete the variance on label and blank rows.
References are relative. A binding’s cell reference moves when the cell is copied or filled. That’s why the shared Version header works across columns. It’s also why a month picker in a single cell, used with Link to a cell, doesn’t survive a fill: the copies would point at the next column. If you want a month picker, give each column its own month cell, or keep Reporting month as the period.
Worked example: the IFRS 18 subtotal
The figures below are illustrative. They show the arithmetic the formulas perform for one month of Actuals, from the cells that feed the new subtotal.
| B8 Gross Profit (=B6-B7) | 1,240,000 |
| B26 Other Income (raw) | 95,000 |
| B28 less Finance Income (by type) | (30,000) |
| B16 less Share of Profit of Associates | (40,000) |
| B9 Other Income | 25,000 |
| B29+B30 Expense and Depreciation | 820,000 |
| B10 less Distribution Costs (IFRS tag) | (210,000) |
| B11 less Administrative Expenses (IFRS tag) | (390,000) |
| B12 Other Operating Expenses | 220,000 |
| B13 Operating Profit (1,240,000 + 25,000 − 210,000 − 390,000 − 220,000) | 445,000 |
| B15 Finance Income (30,000 by type + 12,000 Interest Income) | 42,000 |
| B16 Share of Profit of Associates | 40,000 |
| B17 Profit before Financing and Income Taxes | 527,000 |
| B18 less Finance Costs | (65,000) |
| B19 Profit Before Tax | 462,000 |
Total expense is 820,000 whichever way you split it: 210,000 + 390,000 + 220,000. The tags change how the expense is presented, not the total. The 40,000 share of associates comes out of Other Income and appears once below Operating Profit, in the investing category, which is the reclassification IFRS 18 requires.
Hide the helper block and finish the sheet
Select row headers 25 to 32, right-click and choose Hide Selected Rows. The helper figures keep feeding the formulas but no longer appear. Unhide hidden rows on the same menu brings them back. In the formatting toolbar, use Bold and Top Border on the subtotal rows, and Top and Double Bottom Border on Profit for the Year.
Save the report. Readers open it from the report list, and the financial cells resolve for the month the report is run for. In the viewer, a reader can right-click a cell to leave a comment on it. A commented cell shows a corner marker with the comment as its tooltip, which is a convenient place to note why a line moved between categories.
Export to Excel with the formulas intact
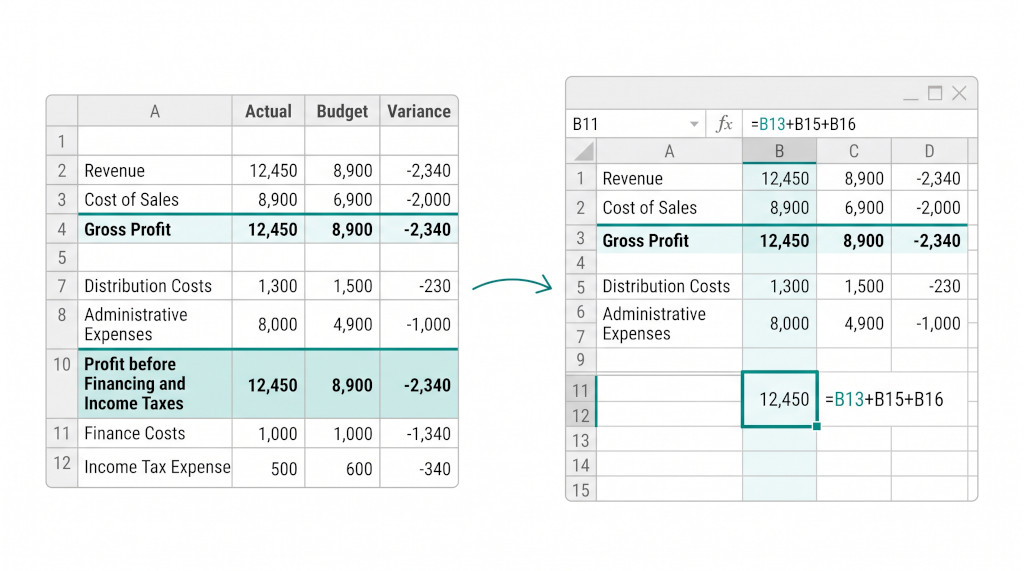
The viewer’s Export to Excel action writes formula cells as formulas and financial cells as numbers. Open the file and B17 contains =B13+B15+B16, not just 527,000. Hidden rows stay hidden, and any freeze pane you set is carried over. A reviewer can trace Profit Before Tax back through every subtotal to the figures the system produced, without asking how the number was built. Export to PDF is next to it for the printed pack.
Already overriding the system IFRS P&L? Rebind the tagged lines
The system Consolidated Profit and Loss (IFRS) report can also become a cell-based report. Use Override Report, then choose Cell-based report in the Choose System Report editor dialog. This creates a cell-based override of the report for your subscription, with Restore default available in the viewer.
In that conversion, lines the system report reads by tag — Distribution Costs, Administrative Expenses and Share of Profit of Associates — come across as values captured when the override is created, not as live reads. This is deliberate. The system report’s tagged rows don’t record whether they are a movement or a balance, and guessing that would risk showing a figure that doesn’t match the statement.
To make those lines live, select each cell and bind it with Accounting standard tag, as described above. The tag source asks for the basis explicitly, so the cell reads the same figure the statement shows.
Checklist: your first IFRS 18 cell-based report
- On the Accounting Standard screen, confirm IFRS is enabled for the group and the accounts behind Distribution Costs, Administrative Expenses and Share of Profit of Associates carry their IFRS tags.
- In Custom Reports, add a report and choose Cell-based report.
- Enter the title, labels and the Actual / Budget / Variance headers in row 5.
- Bind the financial cells in column B: Accounting standard tag for B10, B11 and B16; System account type or Account type total for the rest.
- Enter the formulas, including
=B13+B15+B16for Profit before Financing and Income Taxes. - In every financial cell in column B, set Version to cell reference
B5. - Fill B6:B32 right into column C and type Budget in C5. Enter
=B6-C6in D6 and fill down. - Hide rows 25 to 32 and apply subtotal formatting.
- Compare column B against the system Consolidated Profit and Loss (IFRS) for the same month. Revenue, Operating Profit, Profit before Financing and Income Taxes and Profit for the Year should match.
- Save, export to Excel, and check that B17 holds the formula rather than a pasted value.
Build your IFRS 18 statement in BrizoConsol
Start a free trial and build your first cell-based report on your own consolidation. Start Free Trial