How to Build a Consolidated Group Dashboard That Shows Actuals, Budget, and Prior Year Across Every Entity in One View
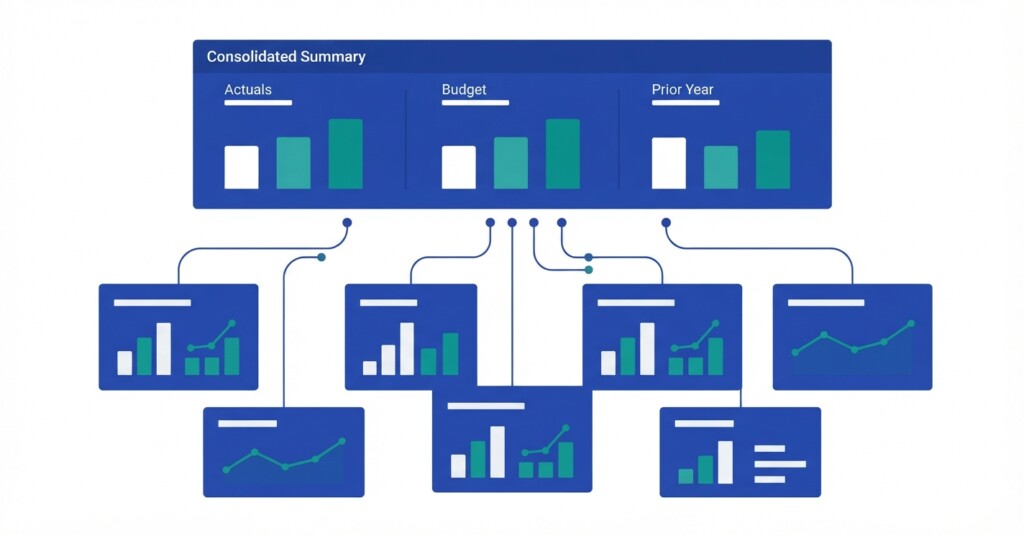
For any finance team managing more than one legal entity, the monthly reporting cycle often ends with the same uncomfortable question: ‘Which version of the numbers is the right one?’ You have actuals from the accounting system, a budget spreadsheet someone built six months ago, prior-year figures pulled from last year’s close, and entity-level reports that still include intercompany transactions that should have been eliminated. Pulling all of this into a single coherent view — one that your CFO, board, or investor can actually use — is the real challenge of group reporting.
This article walks through exactly how to design and build a consolidated group dashboard that shows actuals, budget, and prior year side by side, across every entity, in one place. It covers the structural decisions, the accounting mechanics, and the practical workflow steps you need to get there without rebuilding Excel every month.
Why a Single Entity View Is Never Enough
The problem starts with how accounting software is built. Most systems — even good ones — are designed around a single entity. Your general ledger, your chart of accounts, your period-end close: all of it is scoped to one company file. If you have three subsidiaries, two branches, and a holding company, you typically have six separate instances of your accounting software producing six separate sets of reports.
Stop building consolidations in spreadsheets.
BrizoConsol automates multi-entity consolidation — setup in minutes, reports the same day.
The finance team then manually exports each set of reports, maps them to a common chart of accounts, eliminates intercompany balances, applies foreign currency translation if any entities report in a different currency, and assembles the consolidated view in a spreadsheet. This process is repeated every month. Every month, someone has to do it from scratch or patch last month’s file. And every month, there is a meaningful risk of error.
A well-designed consolidated group dashboard does not just show group totals. It lets a CFO or controller drill from the group P&L down to an individual entity, compare actuals against budget and prior year at every level, and identify variances without switching between systems or spreadsheets.
Step One: Establish a Unified Chart of Accounts
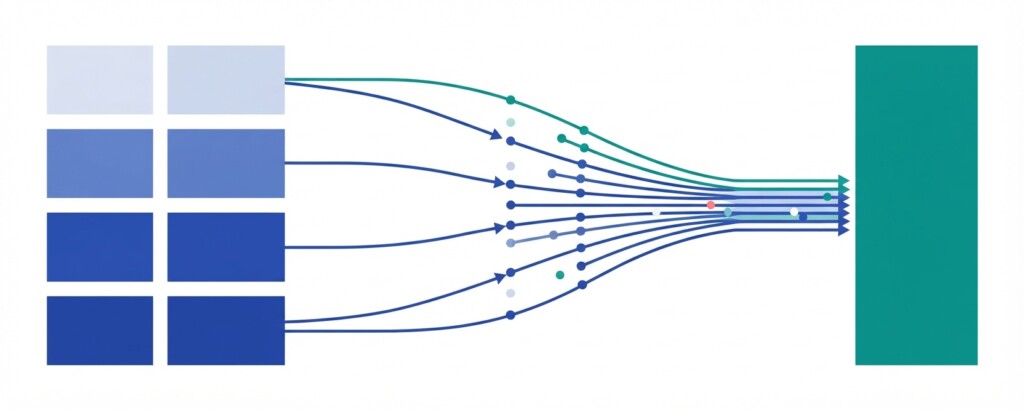
The foundation of any group dashboard is a single chart of accounts that every entity maps to. Individual entities may use different account codes in their own systems — particularly if they are on different software platforms, or if some were acquired and never fully standardised. For reporting purposes, what matters is that every transaction can be classified into the group chart of accounts.
In practice, this means maintaining a mapping table. Each entity has its local account codes, and each local code maps to a group-level account. This is usually a many-to-one relationship: an entity might have three different sales accounts that all map to a single ‘Revenue’ line in the group report. The mapping layer is what allows you to aggregate meaningfully.
Step Two: Define the Consolidation Structure
Before you build any reporting, you need to define the ownership and consolidation structure of your group. This determines how each entity’s results are included in the group figures and whether any non-controlling interest adjustments are required.
| Entity | Ownership % | Consolidation Method | Reporting Currency | NCI Required? |
|---|---|---|---|---|
| HoldCo (Parent) | 100% | Full consolidation | GBP | No |
| OpCo UK Ltd | 100% | Full consolidation | GBP | No |
| OpCo Germany GmbH | 100% | Full consolidation | EUR → GBP | No |
| OpCo Australia Pty | 75% | Full consolidation | AUD → GBP | Yes — 25% |
| JV Partner Co | 40% | Equity method | USD → GBP | No |
Once you have this structure documented, your dashboard logic can be built to reflect it automatically. Fully owned entities are consolidated line by line. Entities with minority ownership require a non-controlling interest (NCI) deduction. Associates accounted for under the equity method appear as a single line in the group P&L and balance sheet rather than having their revenues and costs included.
Step Three: Handle Foreign Currency Translation
For any group with entities reporting in different currencies, FX translation is unavoidable. The standard approach under both IFRS and most local GAAP frameworks is to translate P&L items at average rates for the period and balance sheet items at the closing rate. The difference that arises from applying different rates to the opening balance sheet, P&L, and closing balance sheet is recognised in other comprehensive income as a foreign currency translation reserve.
| OpCo Germany GmbH — Revenue (EUR 850,000 × avg rate 0.86) | £731,000 |
| OpCo Germany GmbH — Operating Costs (EUR 620,000 × avg rate 0.86) | £533,200 |
| OpCo Germany GmbH — Net Assets at close (EUR 1,200,000 × closing rate 0.87) | £1,044,000 |
| FX Translation Reserve movement (balancing figure to equity) | £8,400 |
| Total GBP contribution to Group Revenue | £731,000 |
This translation step needs to happen before consolidation aggregation. Your dashboard should store the translated figures as the input to the group view, not the local currency figures. Ideally, the system applies the correct rates automatically using a rate table maintained centrally, so the finance team is not manually converting figures in a spreadsheet.
Step Four: Eliminate Intercompany Transactions
Any transaction that occurs between two entities within your group must be eliminated from the consolidated view. If OpCo UK Ltd charges a £50,000 management fee to OpCo Germany GmbH, then in the consolidated accounts that income and that expense cancel each other out — the group has not earned anything from itself. Similarly, any intercompany loans, dividends, or trading balances must be eliminated.
| Account | Dr | Cr |
|---|---|---|
| Intercompany Revenue (OpCo UK — Management Fee Income) | 50,000 | |
| Intercompany Expense (OpCo Germany — Management Fee Cost) | 50,000 |
Elimination of intercompany management fee charged by OpCo UK Ltd to OpCo Germany GmbH for the period. Both entities recorded the transaction in their own accounts; this journal removes both sides from the consolidated P&L so that only third-party revenues and costs are reported at group level.
Intercompany eliminations are often where manual consolidation processes break down. If the two entities have not recorded the transaction at the same value — perhaps because of currency differences, timing, or billing disputes — the elimination does not net to zero and you have an intercompany mismatch. Identifying and resolving these mismatches before closing the period is one of the most time-consuming parts of the financial close cycle.
Intercompany mismatches are one of the most common causes of delayed group reporting. If your entities are booking intercompany transactions independently without a matching or confirmation workflow, expect reconciliation problems every month. A structured intercompany confirmation process — where both sides agree the transaction before period close — dramatically reduces this risk.
Step Five: Calculate and Present Non-Controlling Interests
Where your group owns less than 100% of a subsidiary — such as the 75%-owned Australian entity in the example above — you must separately identify the share of results and net assets that belongs to the minority shareholders. This is the non-controlling interest, or NCI.
In the consolidated P&L, you include 100% of the subsidiary’s revenue and costs (because you control the entity), but then deduct the NCI share of post-tax profit as a separate line before arriving at profit attributable to the owners of the parent. Similarly, on the consolidated balance sheet, NCI appears as a component of equity, separate from equity attributable to the parent’s shareholders.
Step Six: Bring Budget and Prior Year Into the Same View
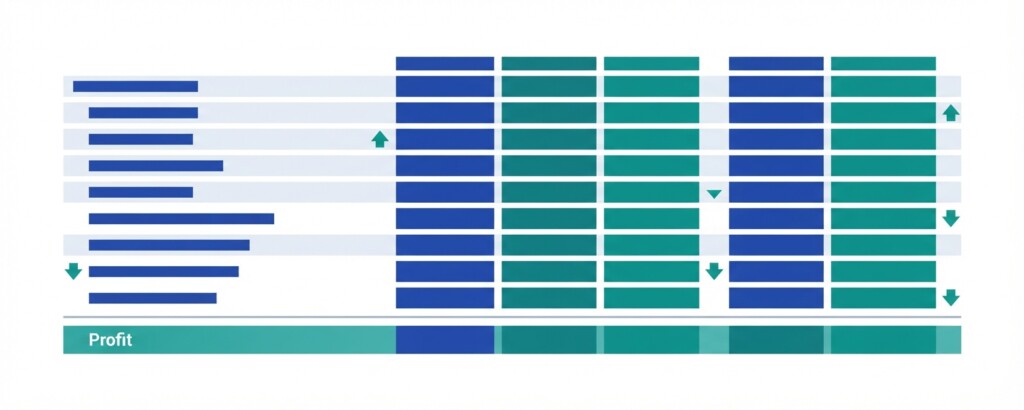
A consolidated dashboard is most useful when actuals can be compared in real time against the budget and against the equivalent period last year. This requires that both budget and prior-year data are structured in the same way as actuals: mapped to the same group chart of accounts, translated at appropriate rates, and consolidated at the same level of detail.
Budgets are typically built at entity level, in local currency, at the start of the year. For a group dashboard, each entity’s budget needs to be translated to the group reporting currency at a budget rate (often set at the start of the year and held fixed, so that budget-versus-actual variances reflect operational performance rather than currency movements). Prior-year actuals should be pulled from the closed prior-year consolidation and held as a reference dataset.
- Load each entity’s approved budget into the reporting system at local currency, mapped to the group chart of accounts.
- Apply the agreed budget FX rates for the year to translate each entity’s budget to group reporting currency.
- Store the prior-year consolidated actuals as a locked dataset — not refreshed or editable.
- Present actuals, budget, and prior year in adjacent columns at each level of the P&L and balance sheet.
- Calculate variance columns: actuals vs budget (amount and percentage) and actuals vs prior year (amount and percentage).
- Ensure all three datasets are available at both group level and individual entity level, so users can drill through.
Structuring the Dashboard Itself
With the data foundations in place, the dashboard design determines how useful it actually is day to day. A good consolidated group dashboard typically has several distinct views: a group summary P&L, a group balance sheet, a cash flow summary, an entity-by-entity breakdown, and a variance analysis view.
The most critical design principle is that every figure at group level should be drillable to its entity-level components. If the group shows £2.1 million in revenue, a CFO should be able to click through and see how much came from each entity, what the budget was for each, and how each entity compares to last year. This drillability is what separates a genuine management reporting tool from a static summary report.
| P&L Line | Group Actual (£) | Group Budget (£) | Variance (£) | Prior Year (£) | YoY Change (£) |
|---|---|---|---|---|---|
| Revenue | 4,820,000 | 4,600,000 | +220,000 | 4,210,000 | +610,000 |
| Cost of Sales | (2,940,000) | (2,800,000) | (140,000) | (2,580,000) | (360,000) |
| Gross Profit | 1,880,000 | 1,800,000 | +80,000 | 1,630,000 | +250,000 |
| Operating Expenses | (1,140,000) | (1,100,000) | (40,000) | (1,020,000) | (120,000) |
| EBIT | 740,000 | 700,000 | +40,000 | 610,000 | +130,000 |
| Interest & Finance Costs | (85,000) | (80,000) | (5,000) | (72,000) | (13,000) |
| Profit Before Tax | 655,000 | 620,000 | +35,000 | 538,000 | +117,000 |
| Tax | (163,750) | (155,000) | (8,750) | (134,500) | (29,250) |
| Profit After Tax | 491,250 | 465,000 | +26,250 | 403,500 | +87,750 |
| NCI (25% of Aust. PAT) | (32,000) | (30,000) | (2,000) | (28,000) | (4,000) |
| Profit Attributable to Parent | 459,250 | 435,000 | +24,250 | 375,500 | +83,750 |
Reducing the Month-End Workload
The biggest practical benefit of a well-structured consolidated dashboard is what it removes from the monthly close cycle. When the consolidation logic — the mappings, eliminations, FX translations, NCI calculations, and budget comparisons — is embedded in the reporting infrastructure rather than rebuilt in Excel each month, the finance team shifts from data assembly to analysis.
This typically means the CFO or controller is looking at variance explanations rather than checking formula references. It means the board pack is produced in hours rather than days. It means that when a subsidiary updates its figures after initial submission, the consolidated view updates automatically rather than requiring someone to manually re-import and re-aggregate.
The financial close process becomes more predictable when the consolidation steps are systematic. Teams can run a soft close earlier in the month, identify intercompany mismatches before the deadline, and arrive at the final close with fewer surprises. This is the practical payoff of investing in the data architecture described above.
Connected Accounting Data as the Long-Term Foundation
The most durable version of a consolidated group dashboard is one built on connected, live accounting data rather than periodic exports. When each entity’s accounting system feeds data into a central consolidation layer — either through direct integration or through a structured submission process — the dashboard reflects the current state of each entity’s books rather than last week’s export.
This connectivity also makes it easier to enforce consistency. The consolidation layer can flag when an entity has not submitted, when intercompany balances do not match, or when a transaction has been posted to an account that does not map cleanly to the group chart of accounts. These are the kinds of data-quality checks that, in a manual process, get discovered at the worst possible moment — late on a reporting deadline.
Building toward connected, automated consolidation is not a single project — it is an incremental improvement to your reporting infrastructure. Most finance teams start by standardising the chart of accounts mapping, then formalising the intercompany elimination process, then automating the FX translation step, and progressively reducing the manual work involved in each monthly close.
See Consolidated Group Reporting in Practice
BrizoConsol is built for finance teams managing multiple entities who need consolidated actuals, budget, and prior year in one view — with intercompany eliminations, FX translation, and NCI handled automatically.