How to Consolidate Multiple QuickBooks Companies: A Practical Guide for Multi-Entity Groups
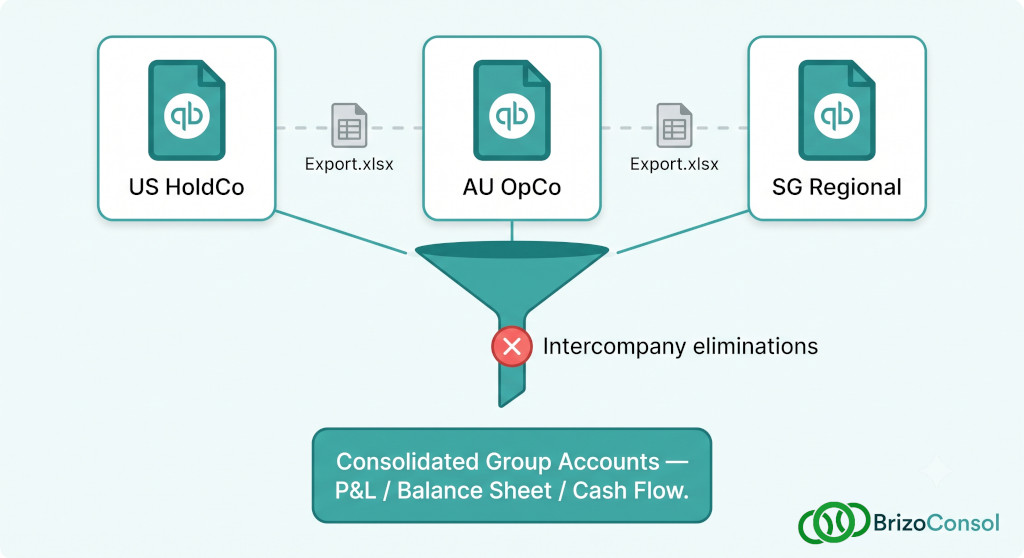
Sarah runs finance for Cascade Group — a US holding company with two operating subsidiaries: one in Australia, one in Singapore. Every quarter, her consolidation process starts the same way: she opens three browser tabs, logs into three separate QuickBooks Online accounts, runs a P&L report in each, and exports them to Excel. Then the real work begins.
She builds a spreadsheet that stacks the three P&Ls side by side, converts the AUD and SGD figures to USD using rates she looks up manually, adds a column for eliminations, and works through the intercompany transactions she noted during the quarter. The whole process takes two and a half days. The output is a consolidated P&L that she is reasonably confident is correct — but which has no audit trail, cannot be reproduced automatically, and needs to be rebuilt from scratch next quarter.
This is the standard manual consolidation process for QuickBooks multi-entity groups. It works. It is also time-consuming, error-prone, and does not scale. This guide walks through the process step by step, explains where it reliably breaks down, and covers what the alternative looks like.
Multi-entity QuickBooks consolidation, done for you.
Connect all your QuickBooks companies and get consolidated financials instantly.
Why QuickBooks Cannot Consolidate Multiple Companies Natively
QuickBooks Online is built around the single-company model. Each company file is an isolated accounting environment: its own chart of accounts, its own transaction history, its own bank feeds, its own reports. There is no mechanism within QuickBooks — on any plan, including Advanced — to combine data across two or more company files, identify intercompany balances, or produce consolidated financial statements.
This is not a feature gap that Intuit is likely to close. The single-entity model is architectural — it reflects how QuickBooks is designed and priced. Group consolidated accounts require a layer above the individual entity accounting, and that layer sits outside the QuickBooks product boundary.
For groups with two or three companies, this is manageable with a spreadsheet. For groups with five or more, or for groups with foreign currency subsidiaries, or for groups that need consolidated accounts monthly rather than quarterly, the spreadsheet approach becomes a bottleneck. Understanding exactly where and how it breaks is useful before evaluating alternatives.
The Manual Process: Step by Step
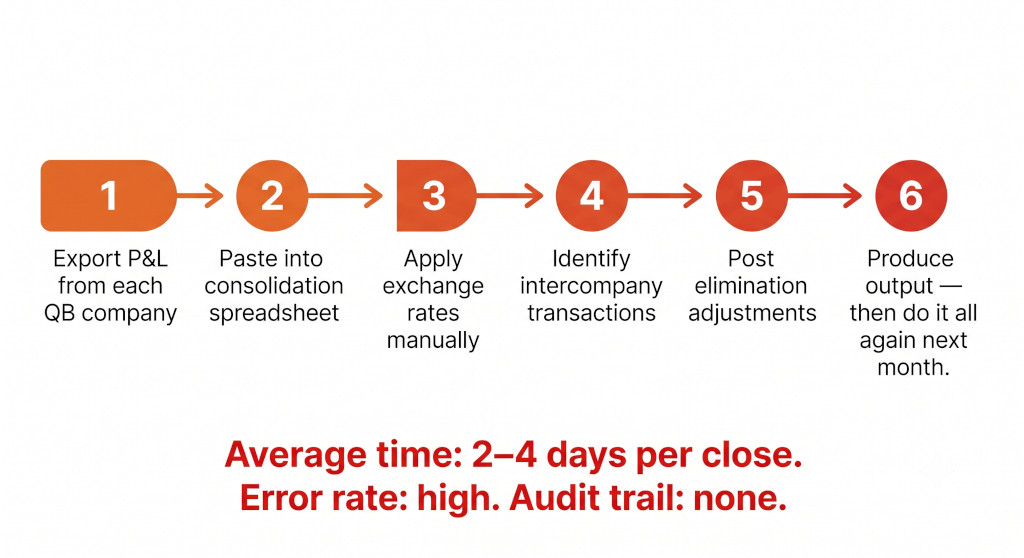
Step 1
Export the trial balance or P&L from each QuickBooks company
Log into each QuickBooks company file separately. Run the Profit and Loss report for the period. Export to Excel. Repeat for the Balance Sheet. If you need a consolidated cash flow statement, you will also need to export sufficient transaction detail to reconstruct cash movements — QuickBooks’ standard Cash Flow Statement is generated automatically and cannot be easily combined across companies. For each period, you are making at least six exports before you start any consolidation work (P&L and Balance Sheet for each of three companies).
Step 2
Align the chart of accounts across companies
Each QuickBooks company will have its own chart of accounts, set up independently. Before you can add numbers together, you need to map each company’s accounts to a common group chart of accounts. If the companies were set up with consistent account structures, this is straightforward. If they were not — if the Australian subsidiary calls its main revenue account “Revenue” and the Singapore subsidiary calls it “Sales Income” — you need a mapping table that assigns each account to a group account. This mapping table needs to be maintained every time any company adds a new account, which in a growing group happens regularly.
Step 3
Translate foreign currency figures to the reporting currency
For each foreign subsidiary, income statement figures need to be translated at the average exchange rate for the period; balance sheet figures need to be translated at the closing rate on the last day of the period. You will need to look up these rates (typically from a central bank or market data source), apply them to each line in the subsidiary’s accounts, and record the resulting translation difference in a foreign currency translation reserve account on the consolidated balance sheet. This difference — the Currency Translation Adjustment — arises because the same period’s opening and closing balance sheet figures are translated at different rates. It cannot be avoided; it must be calculated and posted correctly.
Step 4
Identify all intercompany transactions for the period
Any transaction between two entities in your group needs to be eliminated from the consolidated accounts. This includes: management fees charged by HoldCo to subsidiaries, intercompany sales of goods or services, intercompany loans and the interest on them, dividends paid between entities, and any other cross-entity transactions. You need a record of all such transactions for the period — ideally maintained as they occur, because reconstructing them at quarter-end from memory is unreliable. For each transaction, you should have the amount recorded in both entities’ accounts, the dates, and the account codes on each side.
Step 5
Post the elimination adjustments
For each intercompany transaction, post a journal entry in the consolidation spreadsheet that removes both sides of the transaction. If HoldCo charged a $50,000 management fee to AU OpCo: debit Management Fee Revenue (HoldCo) $50,000, credit Management Fee Expense (AU OpCo) $50,000. This reduces both consolidated revenue and consolidated costs by $50,000 — the transaction disappears from the group P&L entirely, which is correct because it was an internal transfer. Intercompany balances on the balance sheet — intercompany receivables and payables — are eliminated similarly. On the balance sheet, both sides must be eliminated; any residual difference (typically from timing or FX rate differences on unpaid intercompany balances) requires a separate adjustment.
Step 6
Produce the consolidated output and check it
After all adjustments, sum across all entities and eliminations to produce the consolidated P&L, balance sheet, and (if required) cash flow statement. Check that the balance sheet balances — assets equal liabilities plus equity. Check that retained earnings reconcile to opening retained earnings plus the current period’s net income. Check that any intercompany balances have been fully eliminated (any residual intercompany receivable or payable is a sign that an elimination has been missed or partially posted). Then document what you did, because next quarter you will need to do it again.
Where the Manual Process Breaks Down
The six points where manual QuickBooks consolidation consistently fails
- Exchange rate errors compound silently. Applying the wrong average or closing rate for a period produces a wrong consolidated P&L or balance sheet with no visible indicator. The error typically surfaces at year-end when the auditor asks for the exchange rate schedule — by which point several quarters of data need correcting.
- Intercompany transactions get missed. A management fee posted in October but not collected until January, a recharge invoiced in one company and not yet received by the other — these timing differences mean the consolidation spreadsheet has a residual intercompany balance that is difficult to trace. Over several periods, unresolved residuals accumulate.
- Account mapping drifts. When any QuickBooks company adds a new account, the group mapping table needs to be updated before the next consolidation. If it is not, the new account’s figures are excluded from the consolidated output — silently, with no error message.
- The spreadsheet has no audit trail. If an auditor asks “why is the management fee elimination $48,000 rather than $50,000?” the answer requires going back through email chains and QuickBooks exports from the relevant quarter. The consolidation spreadsheet itself rarely documents the reasoning behind individual adjustments.
- Key-person risk is high. The person who built the consolidation spreadsheet is often the only person who fully understands it. If they leave or are unavailable at quarter-end, the consolidation process stalls.
- It doesn’t scale. A consolidation spreadsheet that takes 2 days for a three-entity group takes 5 days for a six-entity group — not because the work doubled, but because intercompany reconciliation complexity grows with each additional entity pair.
A Worked Example: The Cascade Group Consolidation
To make the elimination mechanics concrete, here is a simplified example using Cascade Group’s three entities for Q2.
Group structure: Cascade Holdings Inc (USD) → Cascade Australia Pty Ltd (AUD) → Cascade Singapore Pte Ltd (SGD)
Intercompany transactions in Q2: Holdings charged a $30,000 management fee to each subsidiary. Australia sold $20,000 of goods to Singapore at cost (no unrealised profit). Holdings has a $200,000 intercompany loan outstanding to Australia, with $2,500 of interest accrued in Q2.
Before eliminations, the combined P&L (after FX translation of AUD and SGD figures to USD) shows:
| Line | Holdings | Australia (USD) | Singapore (USD) | Combined |
|---|---|---|---|---|
| Revenue | $0 | $380,000 | $290,000 | $670,000 |
| Management fee income | $60,000 | — | — | $60,000 |
| Intercompany sales | — | $20,000 | — | $20,000 |
| Interest income | $2,500 | — | — | $2,500 |
| Management fee expense | — | ($30,000) | ($30,000) | ($60,000) |
| Intercompany purchases | — | — | ($20,000) | ($20,000) |
| Interest expense | — | ($2,500) | — | ($2,500) |
| Other costs | ($45,000) | ($290,000) | ($220,000) | ($555,000) |
| Net income | $17,500 | $77,500 | $20,000 | $115,000 |
The combined figure of $115,000 is not the consolidated net income — it includes intercompany revenues and costs that need to be eliminated. The elimination journals in the consolidation spreadsheet are:
Elimination 1 — Management fees
Dr Management Fee Income (Holdings) $60,000Cr Management Fee Expense (AU + SG combined) $60,000
Eliminates both sides of the internal management charge
Elimination 2 — Intercompany goods sale (AU → SG)
Dr Intercompany Sales (Australia) $20,000Cr Intercompany Purchases (Singapore) $20,000
Sold at cost, so no unrealised profit adjustment needed; eliminates the internal transfer
Elimination 3 — Intercompany interest
Dr Interest Income (Holdings) $2,500Cr Interest Expense (Australia) $2,500
Eliminates internal financing income and expense
After eliminations, the consolidated net income is $115,000 − $60,000 − $20,000 − $2,500 + $20,000 + $2,500 = $55,000. Revenue is $670,000 − $60,000 − $20,000 = $590,000. Each elimination has two sides; if either side is missed, the consolidated P&L will be wrong. The intercompany loan balance of $200,000 must also be eliminated from both the asset side (Holdings) and the liability side (Australia) of the consolidated balance sheet — leaving no trace of the internal loan in the group accounts.
This example involves three entities and three intercompany relationships. A six-entity group with cross-charges, intercompany inventory, and FX loans can have dozens of elimination entries per period — each of which needs to be correct, documented, and reproducible.
What a Properly Consolidated Set of Group Accounts Includes
What consolidated group accounts must contain
- A consolidated income statement with all intercompany revenues and costs eliminated
- A consolidated balance sheet with intercompany assets and liabilities netted off, and goodwill on acquisition presented separately
- A consolidated cash flow statement showing group cash generation and use (excluding internal transfers)
- A foreign currency translation reserve (FCTR / CTA) on the balance sheet reflecting unrealised translation differences on foreign subsidiaries
- Non-controlling interest (NCI) presented separately in equity if any subsidiary is not 100% owned
- Notes to the accounts covering accounting policies, related party disclosures, and segment information where applicable
The manual spreadsheet approach can produce items one, two, and three if built carefully. Items four and five — the Currency Translation Adjustment and NCI — are frequently omitted from spreadsheet consolidations, either because they are complex to calculate manually or because the person maintaining the spreadsheet is unsure of the methodology. When an auditor requests these items, they often need to be reconstructed retrospectively.
The Automated Alternative: BrizoConsol Alongside QuickBooks
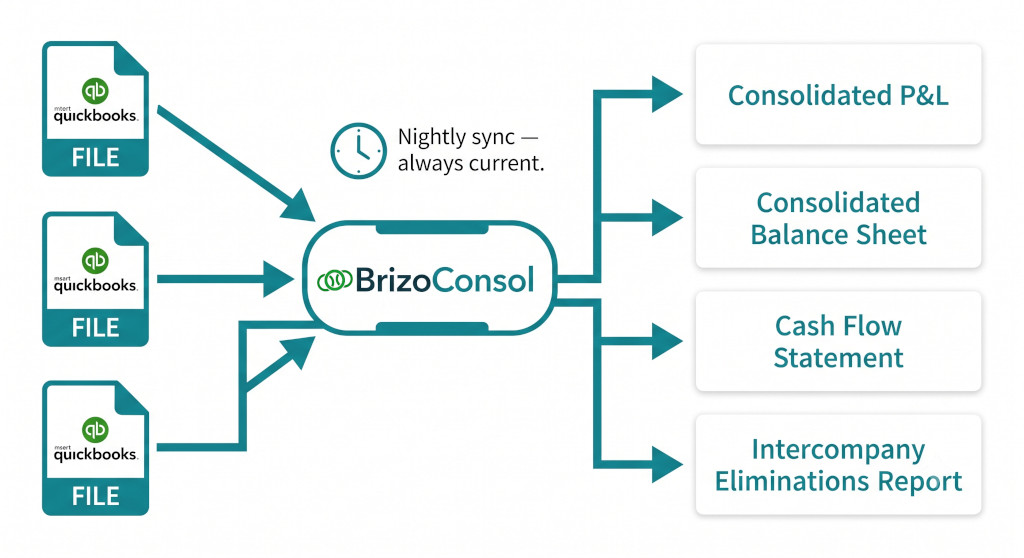
BrizoConsol connects to each QuickBooks Online company via Intuit’s OAuth API. The setup for each company takes a few minutes: click Connect, authorise via Intuit’s OAuth screen, and BrizoConsol begins its initial data pull. After that, each company’s data — chart of accounts, general ledger entries, AR and AP transactions — syncs automatically every night. There are no exports, no spreadsheets, and no manual rate lookups.
The consolidation runs automatically on the synced data. BrizoConsol applies the correct exchange rates (average for income statement items, closing for balance sheet items), computes the Currency Translation Adjustment, and posts it to the foreign currency translation reserve. Intercompany eliminations are configured once in BrizoConsol — you identify the intercompany relationships and the accounts used for intercompany transactions — and then applied automatically every period. The consolidated P&L, balance sheet, and cash flow statement update as each company’s data syncs.
For groups where some entities use QuickBooks and others use Xero, MYOB, or Zoho Books, BrizoConsol consolidates across all connected platforms. The group accounts treat all entities equally regardless of which accounting system each entity runs on.
The practical difference at month-end
With the manual process, Sarah’s month-end consolidation for Cascade Group took two and a half days. With BrizoConsol connected to all three QuickBooks companies, the consolidated P&L and balance sheet update automatically each night. At month-end, she reviews the consolidated output, confirms that intercompany balances are fully eliminated (the intercompany reconciliation report in BrizoConsol shows any residuals), and signs off. The process that took two and a half days now takes under an hour — and the output has a complete audit trail.
Stop Rebuilding Your Consolidation Spreadsheet Every Month.
Connect your QuickBooks companies to BrizoConsol in minutes. Consolidated P&L, balance sheet, and cash flow — produced automatically, with intercompany eliminations and currency translation handled for you. Start Free Trial
Is Manual Consolidation Ever the Right Answer?
For a two-entity group where both entities are in the same currency, have no intercompany transactions other than an occasional dividend, and only need consolidated accounts once a year for statutory purposes, a spreadsheet consolidation is entirely reasonable. The complexity is low, the time investment is modest, and the risk of error is manageable.
As any of those conditions changes — more entities, foreign currencies, regular intercompany charges, monthly reporting requirements, external investors or lenders requesting quarterly accounts — the manual approach degrades. The crossover point for most groups is somewhere between three and five entities: below three, spreadsheets work well; above five, they consistently become a problem.
The signal that the manual approach has passed its limit is usually one of two things: either the consolidation takes longer than two days and is blocking other finance team work, or an error is discovered in a previous period’s consolidated accounts — an intercompany balance that was not eliminated, an exchange rate that was applied to the wrong period, a new account that was not added to the mapping table. When either of those happens regularly, the time and risk cost of manual consolidation exceeds the cost of a tool purpose-built for the job.
Ready to Get Your First Automated Consolidated Report?
Connect your QuickBooks companies via OAuth. BrizoConsol handles the eliminations, the currency translation, and the group accounts — so your team spends time analysing the numbers, not building the spreadsheet. Start Free Trial — No Credit Card Required