How to Drill Into a Consolidated Variance and Identify Which Entity, Account, and Transaction Is Responsible
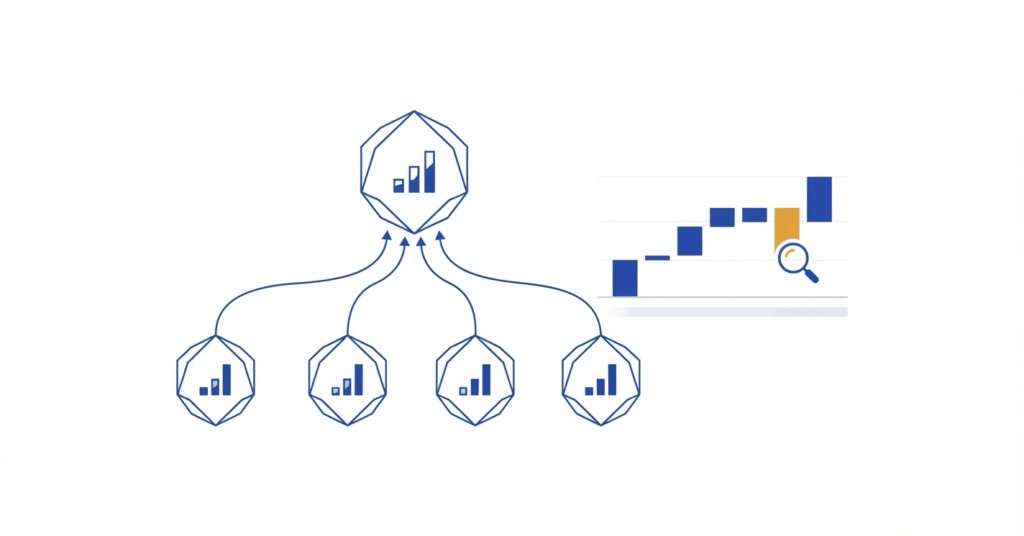
You are reviewing the consolidated P&L for the month and something does not add up. Revenue is £180,000 below budget. Operating costs are up by £43,000. The board pack is due in 48 hours and the CFO wants an explanation. Welcome to one of the most common — and most frustrating — situations in group financial reporting.
The problem is rarely that the numbers are wrong. More often, the variance is real, but the path from the consolidated total to the specific entity, account, and transaction that caused it is buried across multiple spreadsheets, ledger exports, and intercompany workings. This article walks through a structured approach to variance investigation in a multi-entity consolidation, including how intercompany eliminations, FX translation, and non-controlling interests can obscure the root cause if you are not looking in the right places.
Why Consolidated Variances Are Harder to Investigate Than Single-Entity Variances
In a single-entity business, a revenue shortfall of £180,000 leads you directly to the sales ledger. In a group with five or six subsidiaries operating across different currencies and ownership structures, the same variance can originate from any combination of the following sources: an underperforming subsidiary, a foreign exchange retranslation loss, an intercompany transaction that was eliminated on one side but not the other, or a minority interest adjustment that shifted profit attribution.
Stop building consolidations in spreadsheets.
BrizoConsol automates multi-entity consolidation — setup in minutes, reports the same day.
Each of these has a different resolution path. Treating them all as a single ‘budget miss’ leads to incorrect management commentary and, worse, incorrect decisions. The starting point is always to decompose the consolidated variance before attempting any explanation.
A consolidated variance is almost never a single number from a single place. Before you can explain it, you need to decompose it into entity-level, currency, elimination, and ownership components. Skipping this step is the most common cause of misleading variance commentary in group reporting.
Step 1 — Decompose the Variance by Entity
The first analytical layer is always entity-level disaggregation. Take the consolidated actual versus budget comparison and break it down by legal entity or reporting unit. In most groups, the consolidation tool or ERP should allow you to toggle between consolidated and individual entity views on the same chart of accounts. If you are working in Excel, this means maintaining a consistent account mapping across all subsidiary trial balances so that a SUMIF or pivot can quickly isolate each entity’s contribution to the group total.
For our example, suppose the group has four subsidiaries: UK HoldCo, a German operating entity, a US sales subsidiary, and a Singapore branch. The entity-level breakdown of the £180,000 revenue variance might look like this:
| Entity | Budget Revenue | Actual Revenue | Variance | % of Group Variance |
|---|---|---|---|---|
| UK HoldCo | £420,000 | £418,500 | -£1,500 | 1% |
| Germany (EUR) | £310,000 | £261,500 | -£48,500 | 27% |
| USA (USD) | £380,000 | £245,000 | -£135,000 | 75% |
| Singapore (SGD) | £90,000 | £95,000 | +£5,000 | -3% |
| Intercompany Eliminations | -£80,000 | -£80,000 | £0 | 0% |
| Group Total | £1,120,000 | £940,000 | -£180,000 | 100% |
Immediately, the picture changes. Three-quarters of the consolidated revenue shortfall sits in the US subsidiary. Germany has a meaningful but secondary issue. Singapore is marginally ahead. This entity-level view tells you where to investigate next — but it still does not tell you whether the US variance is a trading issue or a translation issue.
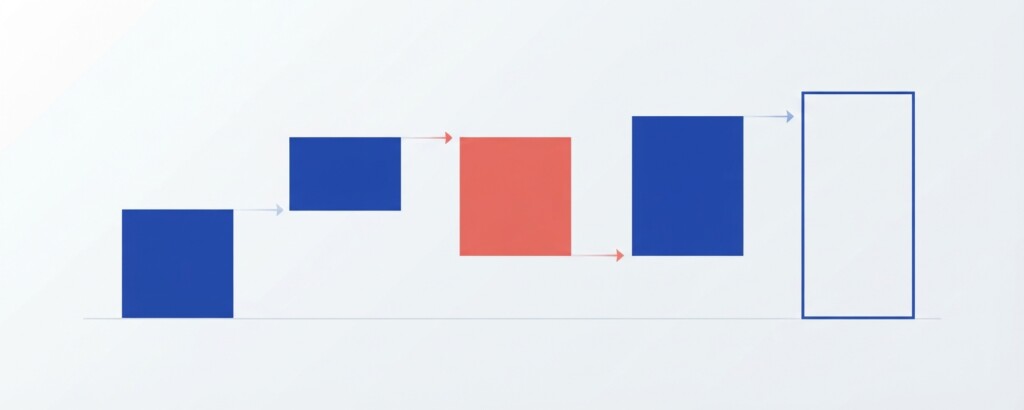
Step 2 — Separate FX Translation Effects From Trading Performance
For any subsidiary that reports in a currency other than the group’s presentation currency, part of the variance against budget may simply reflect exchange rate movements rather than operational underperformance. This is one of the most frequently misidentified sources of consolidated variances.
To isolate the FX translation effect, you need to know two things: the exchange rate used when the budget was set, and the average rate applied during the actual period. The difference between translating actual local-currency results at the budget rate versus the actual average rate gives you the pure translation variance.
| US subsidiary actual revenue (USD) | $318,000 |
| Translated at actual average rate (1.30 USD/GBP) | £244,615 |
| Translated at budget rate (1.18 USD/GBP) | £269,492 |
| FX translation variance (adverse) | -£24,877 |
| Underlying trading variance (balance of US entity gap) | -£110,123 |
In this example, the dollar weakened significantly against sterling relative to the budget assumption. Of the £135,000 US revenue shortfall, approximately £25,000 is attributable to exchange rate movements outside operational control. The remaining £110,000 is a genuine trading shortfall that requires investigation at the account and transaction level. Presenting the full £135,000 as a sales performance issue would be inaccurate and potentially unfair to the US team.
Do not present FX translation variances as operational performance failures. Always separate currency impact from trading impact before presenting variance analysis to the board or business unit managers. Failing to do so undermines trust in group reporting and can lead to poor decisions.
Step 3 — Check the Intercompany Elimination Layer
Before concluding that a variance is fully explained by entity-level trading or FX, you must verify that intercompany eliminations have been applied correctly and consistently between actual and budget. A common source of unexplained consolidated variances is a mismatch in intercompany elimination — for example, a budget that assumed a certain volume of intercompany management fees or recharges which did not actually occur, or an intercompany balance that was eliminated in one period but carried forward incorrectly.
Suppose UK HoldCo charges a monthly management fee of £20,000 to the US subsidiary. In the actual period, this was charged and properly eliminated in consolidation — the income in HoldCo and the expense in the US entity offset each other with no group P&L effect. However, if the budget included this elimination but the underlying charge was temporarily suspended, the elimination model might remove income that was never recorded, creating a false negative in the group revenue line.
| Account | Dr | Cr |
|---|---|---|
| Intercompany Management Fee Income (UK HoldCo) | £20,000 | |
| Intercompany Management Fee Expense (US Sub) — Elimination | £20,000 |
Standard intercompany elimination entry at consolidation level. This entry removes the intragroup fee from both the income line (HoldCo) and the expense line (US subsidiary), so that neither flows into consolidated revenue or cost. If the underlying charge does not occur in a period but the elimination template still runs, it creates a phantom debit against consolidated revenue.
Always reconcile the intercompany elimination schedule between actual and budget periods. Confirm that the actual intercompany balances match what each counterparty entity has recorded. Any discrepancy — where entity A records income that entity B has not recorded as an expense — will survive the elimination process and distort the consolidated result.
Step 4 — Account-Level Drill-Down Within the Problem Entity
Once you have isolated the entity and confirmed that FX and elimination issues are properly quantified, the next step is to drill from the entity-level P&L into individual account categories. For the US subsidiary’s £110,000 trading variance, an account-level breakdown might reveal a concentration in one or two accounts rather than a broad revenue decline.
Drill from the revenue summary account into sub-accounts or product line dimensions. In many general ledger systems, you can filter the trial balance by entity and by account range to generate a view that shows each revenue account, its budget, actual, and variance. In a well-structured chart of accounts, this will narrow the investigation to whether the issue is in product sales, service revenue, licence fees, or another category.

Step 5 — Transaction-Level Investigation
Once the account is identified, the final layer is the transaction detail. This is where you move from reporting into the source ledger — the sales invoices, credit notes, revenue journals, or deferred revenue movements that underlie the account balance. Look for timing differences (revenue recognised in the wrong period), missing invoices, cancelled contracts, or unusually large credit notes.
- Export the transaction detail for the specific account and entity for the period in question.
- Compare transaction volumes and values against the equivalent prior period to identify anomalies.
- Check for large, unusual, or single-line journal entries that may indicate a manual adjustment.
- Verify that deferred revenue movements have been applied consistently — a contract recognised in full rather than over time, or vice versa, can create a significant single-period variance.
- Cross-reference any credit notes issued during the period against corresponding sales invoices to confirm they relate to the current period and are not catching up from a prior period.
- If the variance involves a specific customer or contract, pull the subledger detail and confirm the invoice or recognition schedule.
Non-Controlling Interests and How They Affect Variance Attribution
If any of your subsidiaries are partially owned, non-controlling interest (NCI) allocations add a further layer to variance analysis. In a subsidiary that is 70% owned by the group, only 70% of the subsidiary’s trading variance flows through to the group’s attributable profit. The remaining 30% is allocated to NCI in the consolidated income statement. If the subsidiary has a bad month, the NCI allocation partially shields the group’s retained earnings — but this can make the group result appear better than the operational reality.
When investigating profit variances in partially-owned subsidiaries, always present the full entity variance alongside the group-attributable portion and the NCI portion. This ensures that the consolidated commentary accurately reflects the subsidiary’s performance, not just the group’s share of it.
The Role of Automation in Variance Investigation
Much of the drill-down process described above is conceptually straightforward but operationally slow when performed in Excel. Each layer — entity aggregation, FX retranslation, intercompany elimination checking, account-level filtering, transaction export — typically requires opening a different file, applying a different formula, and manually reconciling the outputs. In a group with four or five subsidiaries, a thorough variance investigation can take a full day or more.
Consolidation tools that maintain a connected, drillable data structure — where consolidated figures link directly to entity-level data, which in turn links to account-level and transaction-level detail — can reduce this investigation time substantially. The core requirement is that the consolidation layer does not sever the connection to underlying data. If the consolidation process imports static trial balance snapshots without preserving transaction-level detail, you will always need to go back to the source ledger separately.
Equally important is that FX translation and intercompany elimination are applied as auditable, reviewable calculations rather than black-box adjustments. When you can see exactly what rate was applied to each entity, and exactly which intercompany pairs were eliminated, the investigation process is far more reliable.
Structuring Your Variance Commentary
Once the investigation is complete, the commentary for the board or management pack should follow the same decomposition structure used in the analysis: group total, then entity attribution, then currency effect, then trading explanation, then any intercompany or structural items. A well-structured variance note tells the reader exactly how much of the movement is within management control, how much is structural or currency-driven, and where operational action is needed.
Avoid the temptation to roll all causes into a single sentence. ‘Revenue was below budget due to lower US performance and adverse FX’ is technically accurate but analytically unhelpful. The reader cannot act on it, and the board cannot assess whether the problem is worsening. The drill-down process only has value if the findings are communicated at the right level of granularity.
Building a Repeatable Investigation Framework
The structured approach outlined in this article — decompose by entity, strip out FX, verify eliminations, drill to account, investigate transactions — works best when it is documented and followed consistently each period. Groups that treat variance investigation as an ad hoc exercise tend to produce inconsistent commentary and miss recurring issues. Groups that embed the framework into their close process catch problems faster and produce more credible management reporting.
Consider maintaining a standard variance investigation template that captures each layer of the decomposition, with cells or fields for entity contribution, FX impact, elimination check, and account detail. Even in Excel, a consistent template dramatically reduces investigation time and makes it easier to hand off the analysis to a colleague or auditor.
See How BrizoConsol Handles Multi-Entity Variance Drill-Down
If your current consolidation process makes it difficult to trace a group variance back to its source entity and transaction, explore how a connected consolidation platform can make this investigation faster and more reliable.