The data loading page, rebuilt from the ground up
Until now, the data loading page in BrizoConsol gave you a list: one row per period, a status cell that said “loaded 3 days ago” or left the cell blank, and a button to load either a single month or a range. It worked, but it made the wrong question easy to ask. The question most finance teams actually want answered is not “when was March loaded?” — it is “do I have everything I need for the consolidation run?” The old list answered the first. It could not answer the second without scrolling through every row.
A multi-entity group has a lot of periods. A Xero-connected leaf entity with twelve months of trial balance, invoices and bills has thirty-six data points to check before the consolidation is ready. Doing that visually, row by row, is the kind of work that introduces errors without anyone noticing.
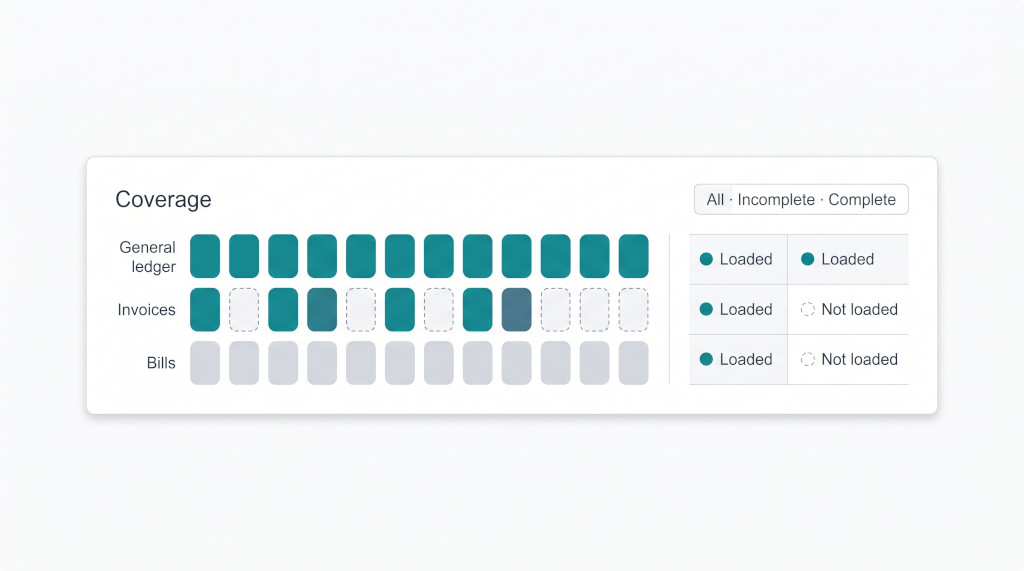
The new data loading page is designed to answer the right question first. A coverage matrix at the top shows, in a single compact grid, which data types are loaded across every fiscal month. A sync bar surfaces the connector schedule and any errors in one place. The period table underneath is grouped by fiscal year, filterable by completeness, and selectable — tick the months you want, the page works out what is missing, and a single click loads exactly that.
Stop building consolidations in spreadsheets.
BrizoConsol automates multi-entity consolidation — setup in minutes, reports the same day.
The sync bar: schedule and errors in one place
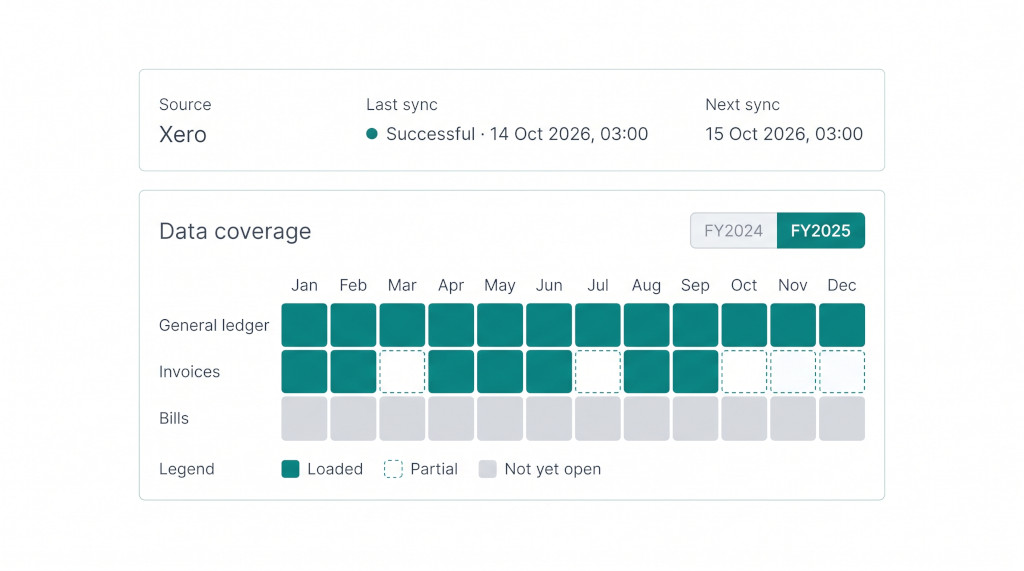
The sync bar sits at the top of the data loading page, above the coverage matrix. It shows three things side by side: the data source (Xero, QuickBooks, MYOB, or Zoho Books), when the last sync ran and whether it succeeded, and when the next scheduled run is due.
The last-sync cell uses a coloured dot to communicate state without requiring the user to parse a word: a teal dot for a successful run, a red dot when the last run failed, and an animated spinning ring while a sync is actively running. The timestamp sits in muted text next to the state — there when you want it, not the first thing you see.
When a sync fails — a connector timeout, an expired token, a Xero reconnection required — the error message appears inline in the sync bar rather than as a floating flash banner. A reconnect button appears beside the error for Xero connections. The bar stays visible throughout the page; there is no need to scroll back to the top to see whether an in-progress load has finished.
The sync bar appears on connector-linked entities (Xero, QuickBooks, MYOB, Zoho Books) and on the CSV upload page. Manual-only entities that have no scheduled sync still show the bar without next-sync times.
The coverage matrix: all twelve months, all data types, one grid
Below the sync bar is the coverage matrix — a compact visual grid that answers “what do I have?” at a glance. Each row is a data type; each column is one of the twelve fiscal months in the selected year. A teal filled cell means that data type is loaded for that month. A dashed outline cell means it is not. A solid grey cell means the period is not yet open — the calendar has not reached that month, so there is nothing to load.
The data types the matrix shows depend on the entity’s connection type. A Xero or QuickBooks leaf entity with invoices and bills enabled will show three rows: General ledger, Invoices, and Bills. A tracking-category entity adds a fourth row. An entity that loads only trial balance shows a single row. The matrix adapts to what is actually relevant, rather than showing empty rows for capabilities the connection does not support.
The fiscal year picker in the top-right corner of the matrix lets you switch between years. It defaults to the most recent year that has any data. Switching years rotates the twelve column labels to the correct fiscal-year months — an entity starting in July sees Jul–Jun across the columns, not Jan–Dec. The count on the right of each row (“9 of 12”) gives a quick completeness figure for the year without counting cells manually.
A small legend below the grid defines the three cell states, so the visual is self-explanatory to any user who has not seen it before.
The period table: grouped, filterable, selectable
Under the coverage matrix is the period table. It replaces the old paginated data table, which put the most recent periods on the first page and everything else behind pagination. The new table groups periods into fiscal years. Each group has a collapsible header that states the year label, the month range it covers, and the count of periods inside it — “FY2025 · Jul–Mar · 9 periods”. Clicking the caret collapses or expands the group.
Each row shows the period label and, in one column per data type, either a teal dot with “Loaded” and the relative time (“2 hours ago”, “yesterday”), or an empty circle with “Not loaded”. The relative time is how the page has always expressed recency; what is new is that each data type has its own cell, so the state of invoices and bills is not buried in a tooltip or omitted entirely.
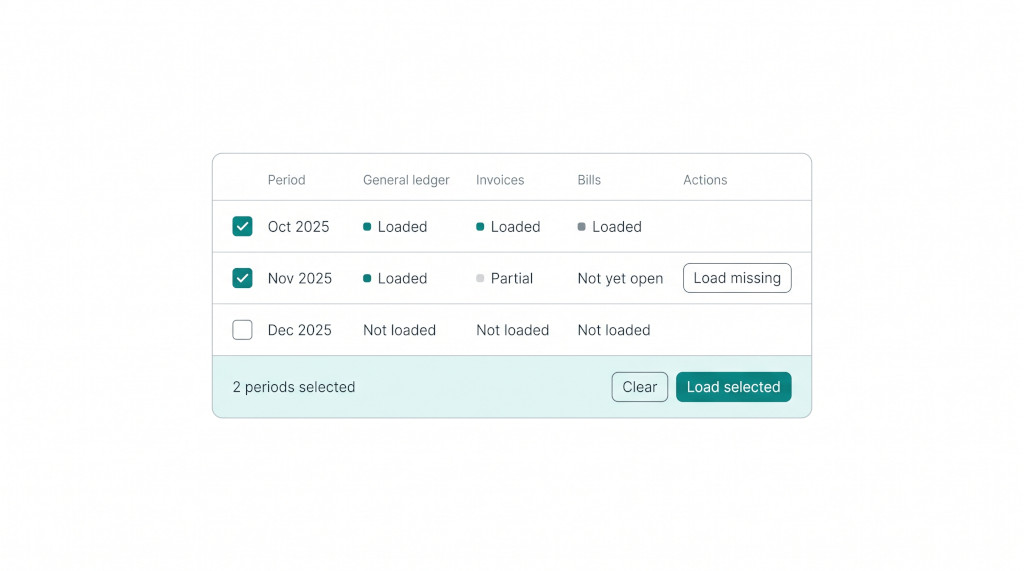
The row action on the right is context-aware. If any data type for that period is missing, the button reads Load missing. If everything is already loaded, it reads Reload. Clicking it opens the load dialog with the missing data types pre-ticked — or, if everything is present, with the general ledger pre-ticked as the reload default. The user does not need to evaluate what to tick before starting the load.
Completeness filter
A three-segment button above the table — All · Incomplete · Complete — filters the visible rows by completeness. Selecting “Incomplete” hides every period that has all its data types loaded; the table shows only what still needs work. Selecting “Complete” does the reverse. The filter works across all expanded groups simultaneously, so switching to “Incomplete” on a three-year entity immediately narrows the view to the periods that are not ready, regardless of which year they fall in.
Bulk selection: load any combination in one step
The old page had two load options: a single-period load triggered from a row, and a “Load Multiple Months” dialog that loaded a contiguous date range. Neither was right when the periods that needed loading were not adjacent — for example, when two months in a quarter had invoices missing but the third was already complete.
The new table is selectable. Each row has a checkbox. Ticking several rows and clicking Load selected in the sticky bulk bar at the bottom of the table opens a load dialog that targets exactly those periods — not the range between them, not all periods in the year, just the ones that were ticked. The dialog shows the selected period labels as chips so it is clear before confirming what is about to be loaded.
The data types the dialog pre-ticks are the ones that any of the selected periods are still missing. If all three of November, December and January have their general ledger loaded but none have invoices, the dialog opens with only Invoices ticked. If November is missing GL and invoices but December has both, the dialog opens with GL and Invoices both ticked — it looks across the whole selection and covers the union of what is missing.
The bulk bar is sticky: it remains visible at the bottom of the screen while the user scrolls through the period table. It shows the count of selected periods with a Clear button to reset the selection and a Load selected button to proceed. When a year group is collapsed, any ticked periods inside it are automatically deselected — a selection that is off screen cannot be reviewed, and it would be confusing to carry invisible periods into a bulk load.
The header row has a select-all checkbox with the standard indeterminate state: checked when every visible period is selected, indeterminate when some are, unchecked when none are.
See the new data loading page in your consolidation
The redesigned page is live in BrizoConsol. Sign in to load a few periods and try the coverage matrix and bulk selection.Start Free Trial
The “Sync now” button and the load dialog changes
The old “Load Multiple Months” button sat in the footer of the data table — below the fold on any entity with more than a few periods. The new Sync now button is in the page header, in the same row as the page title and description. It opens a range load dialog pre-populated with the last three months and all data types unchecked except GL, ready to adjust. The intent is to make the most common action — run a catch-up load to bring the entity up to date — reachable without scrolling.
The load dialog itself now has three distinct modes, each with its own title and subtitle to avoid confusion:
| Mode | Triggered by | What it loads |
|---|---|---|
| Load period | Row action button on a single period | That one period; missing data types pre-ticked |
| Load periods (range) | Sync now in the page header | A from–to date range the user selects; the server walks every month between them |
| Load selected periods | Load selected in the bulk bar | Exactly the checked periods, shown as chips; not the range between them |
The distinction between range and selected is significant. A range load tells the server “load every month from October to December”. A selected load tells it “load October and December but not November”. The two produce the same result only when the selection happens to be contiguous. For targeted catch-up work on non-adjacent periods, the selected mode eliminates the manual step of loading months individually.
CSV import gets the same treatment
The CSV data loading page — used for manual trial balance uploads rather than connector syncs — has received the same overhaul. The coverage matrix and the fiscal-year-grouped period table now appear there too, with the matrix showing a single “General ledger” row (CSV import loads only the trial balance). The completeness filter, the period search, and the collapsible year groups work identically to the connector page.
The CSV table also gains two new columns: Uploaded by (the name of the user who uploaded the file) and File name. Both were available in the old table. They are surfaced here in the same column format as the data-type status columns, making the upload history easier to read at a glance without opening the row.
Getting the most from the new layout
- Check the sync bar first. Before diving into the period table, confirm the last sync succeeded. A red dot means the last connector run did not complete — the data shown may be stale. Reconnect if prompted before loading.
- Use the coverage matrix to scope the work. Switch to the fiscal year you are preparing the consolidation for. The matrix tells you in under ten seconds whether GL, invoices and bills are all present for every month. If a row has gaps, those are the periods to focus on.
- Filter to Incomplete before bulk-selecting. Click Incomplete in the filter to hide everything that is already done. Select all visible rows (header checkbox), then click Load selected. The load dialog pre-ticks only what is missing across the selection.
- Reload a period from its row action. When a specific month needs refreshing — a restatement, a corrected invoice run — use the row’s Reload button. It opens the dialog with GL pre-ticked; add invoices or bills if needed.
- Use Sync now for routine catch-ups. At the start of a reporting cycle, click Sync now in the page header, adjust the from/to range to the current quarter, and start the load. The range mode is the quickest way to load several consecutive months.
Watch a walkthrough of the new data loading workflow
The demo covers the coverage matrix, bulk selection, and all three load modes — from a live BrizoConsol environment. See It In Action