We’ve rebuilt the custom report editor. BrizoConsol’s Custom Reports now work the way you’d expect — like a spreadsheet, with your report laid out row by row in front of you, and empty rows waiting to be configured exactly where you need them.
If you’ve ever wished you could see your group report take shape as you build it, rather than assembling it in a separate settings panel, this update is for you.
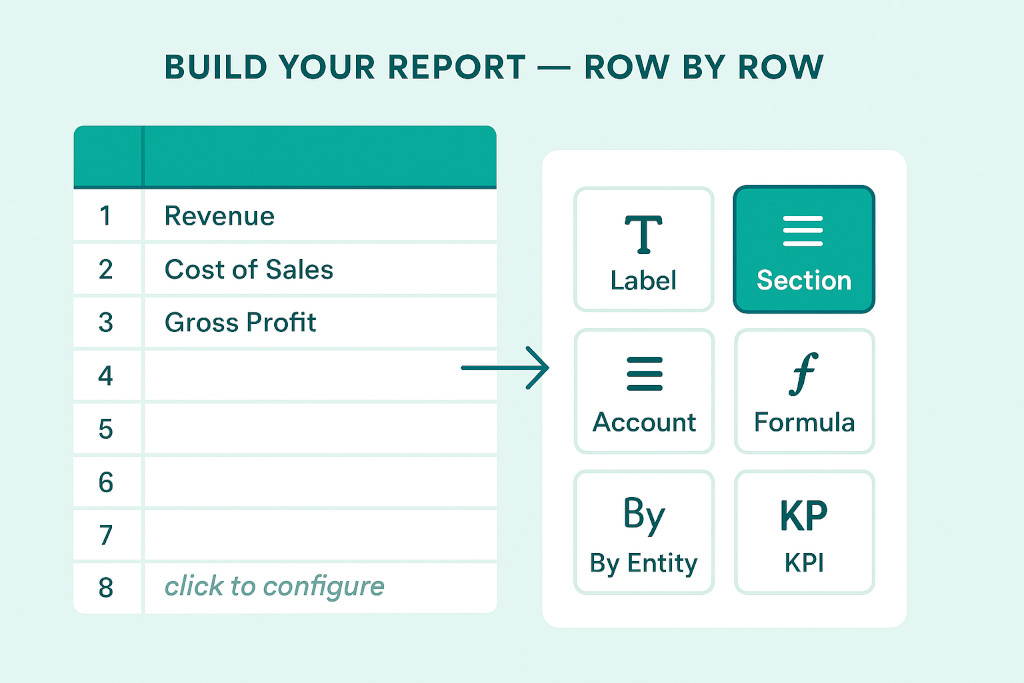
How It Works Now
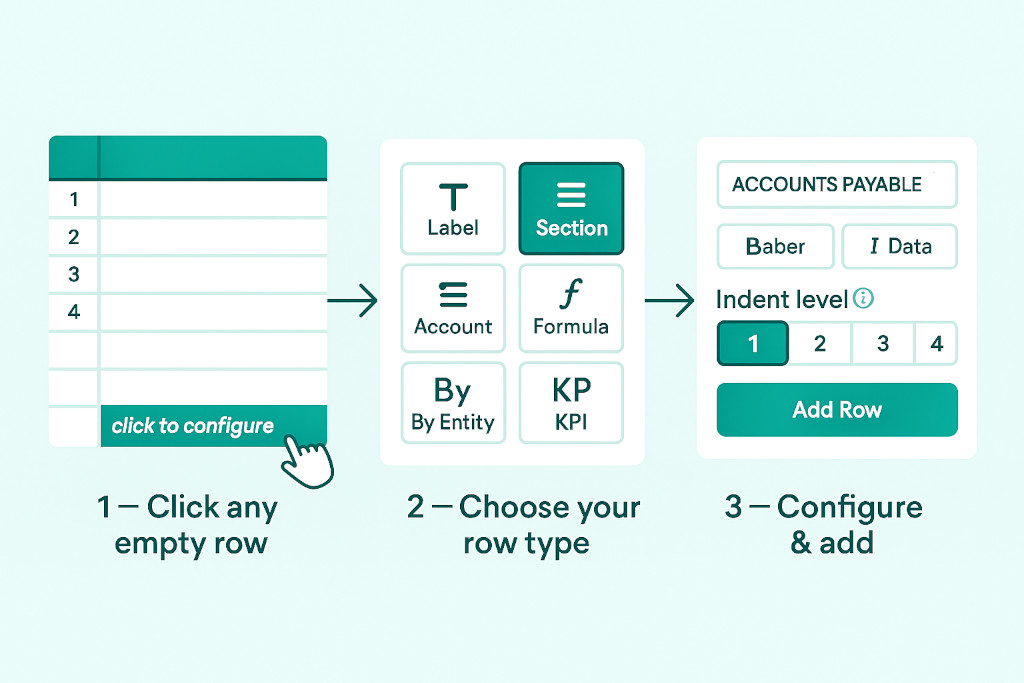
Click any empty row
Open a custom report and click click to configure on any empty row. The row type picker appears.
Choose your row type
Select from seven row types — Label, Section, Account, Formula, By Entity, KPI, or Additional Data.
Configure & add
Set your content, formatting style, indent level and display options, then clickAdd Row. It appears instantly in the live preview.
There is no separate “edit mode” to switch into. The report is always the working surface — you see every row in context as you add it, and the live preview updates immediately so you know exactly what the finished report will look like.
Seven Row Types, One Report
Each row type is purpose-built for a different layer of a group financial report. You can mix and match them freely within a single custom report:
Label
A heading, subheading, or blank spacer row for report layout and readability.
Section
A chart-of-accounts section that renders all its accounts with a section subtotal.
Account
A single ledger account rendered as one row — useful for spotlighting specific lines.
Formula
A calculated row that references other rows, sections, KPIs, or formulas in the same report.
By Entity
Repeats a row group for each entity — ideal for side-by-side entity comparisons in a single view.
KPI
A KPI row using an existing metric definition — bring your key ratios directly into the report.
There is also an Additional Data row type for configured data sets such as revenue by product or by customer — bringing operational context into a financial report without a separate export.
Row Formatting Built In
Every row carries its own formatting options, set at the point you add it. You can choose from four text styles (bold header, bold data, italic header, italic data), set an indent level from 1 to 4, toggle percentage display, hide the row from the rendered output, show empty rows, and add spacing before or after — all within the same configuration panel, before the row is placed.
For teams producing group reports that need to match a specific board template or management pack layout, this means you no longer need to post-process the output. The formatting is part of the report definition itself.
Already using Custom Reports? The updated editor is live in your account now. Open any existing custom report or create a new one under Reports → Custom Reports and you’ll see the new row-by-row interface straight away.