How to Compare Current-Year Consolidated Results With Prior Year
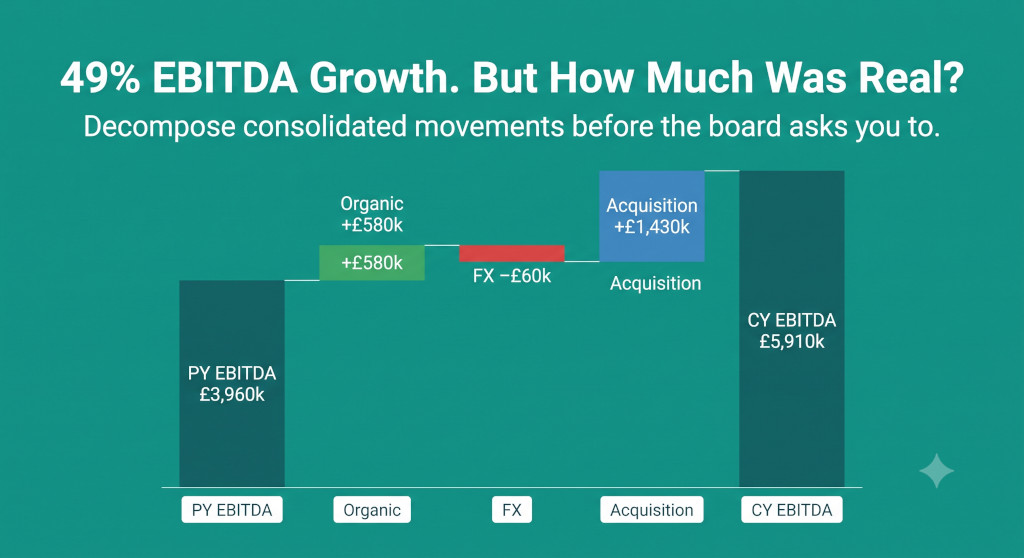
The board pack was on the table. Meridian Group’s consolidated revenue had grown from £16,200k to £21,640k — a 33.6% increase. EBITDA had risen from £3,960k to £5,910k — a 49.2% improvement. The chief executive was pleased. The new non-executive director, who had joined the board in September, was less impressed. “Before we congratulate ourselves,” she said, “can someone tell me how much of this is real improvement in our existing businesses, and how much is because we bought Coastal BV in July?”
James, group financial controller, knew the answer. He had done the work. But he also knew that the board pack contained only the headline numbers — revenue and EBITDA for the year as a whole, compared to the prior year as a whole — and that the answer to the NED’s question was not visible anywhere in the document. The consolidated YoY comparison, as presented, was meaningless without decomposition.
A consolidated YoY comparison mixes organic trading with structural change, blends functional-currency movements with translation effects, and sometimes compares figures that are not on the same accounting basis. Presenting the headline percentage to a board and expecting them to draw conclusions about underlying performance is asking them to read a map with no scale. The job of the group financial controller is to decompose the movement before the board is asked to interpret it.
Stop building consolidations in spreadsheets.
BrizoConsol automates multi-entity consolidation — setup in minutes, reports the same day.
Why Consolidated YoY Is Harder Than Entity YoY
For a single entity that has operated for two full years without acquisitions, disposals, or currency changes, the YoY comparison is straightforward: revenue moved from £X to £Y, and the movement represents trading change. At the consolidated level, four complications break this clean picture.
The first is structural change. An entity acquired on 1 July appears in twelve months of the current year’s consolidated revenue but zero months of the prior year’s. An entity disposed of on 31 March appears in three months of the current year but twelve months of the prior year. The headline consolidated revenue growth includes the full contribution of any mid-year acquisition and loses the full prior-year contribution of any disposal — making the reported percentage change a blend of trading and timing that has nothing to do with underlying performance.
The second is FX translation. A subsidiary that earned €10,000k of revenue in both years has delivered flat performance in its own currency. But if the EUR/GBP average rate moved from 0.858 in the prior year to 0.840 in the current year, the translated GBP contribution falls from £8,580k to £8,400k — a reported decline of £180k with no trading explanation. The FX translation effect is real in accounting terms but invisible in operational terms.
The third is accounting changes. If prior-year comparatives were restated following a prior-period error (as described in How to Handle Prior-Period Adjustments in Consolidated Financial Statements), the comparison base has changed. The YoY movement must be calculated against the restated prior-year figures, and any presentation that shows both “as originally reported” and “restated” comparatives will produce two different YoY percentages. Using the wrong base produces a misleading growth rate.
The fourth is changed consolidation scope. Entities added to or removed from the consolidation scope — for example, an associate that moves to subsidiary status following a step acquisition — change the reported totals in ways that are neither organic nor a conventional acquisition effect. The change in NCI following a step acquisition also affects the profit attributable to owners of the parent, making the YoY EPS or attributable-profit comparison ambiguous without adjustment.
The Four Types of Movement
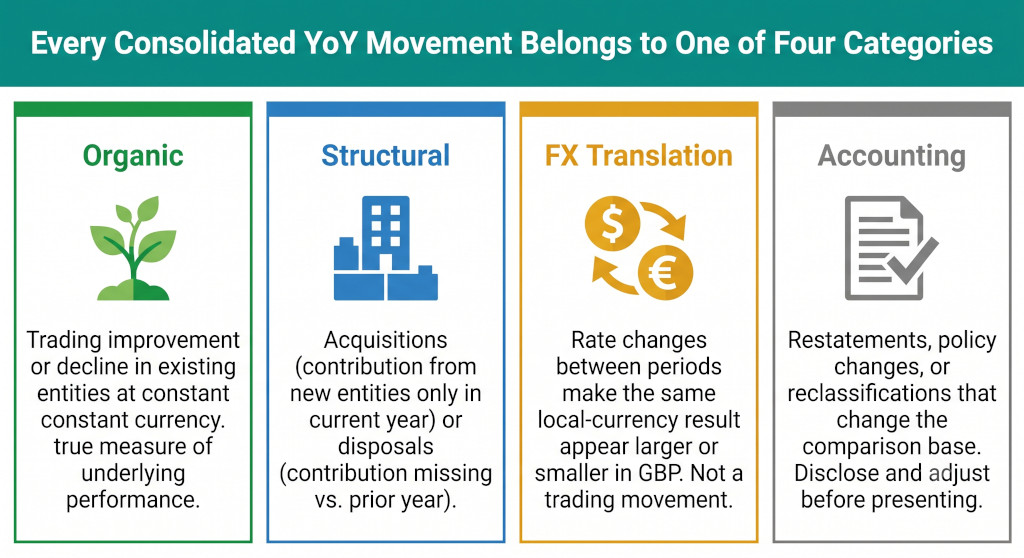
Organic
Trading improvement or decline in entities that were part of the consolidation for both the full prior year and the full current year, measured at constant (prior-year) exchange rates. This is the only component that reflects management’s operational performance in like-for-like terms. It is calculated by taking the current-year results of continuing entities translated at the prior-year average rate, and comparing to the prior-year results of those same entities.
Structural — Acquisition
The contribution of entities acquired during either the current or prior year for the period they were included but that were not present for the full period in both years. An entity acquired mid-current-year contributes only its post-acquisition months in the current year (and zero in the prior year). An entity acquired mid-prior-year contributes a partial year in both — the prior-year post-acquisition period and the full current year.
FX Translation
The movement in consolidated results caused by changes in exchange rates between the prior-year and current-year average rates, applied to the existing entities’ local-currency results. Calculated as the difference between translating continuing entities’ current-year local-currency results at the current-year average rate (what appears in the accounts) versus translating at the prior-year average rate (the constant-currency basis). Not a trading movement.
Structural — Disposal
The reduction in consolidated results from entities disposed of during either year, measured as the difference between what the disposed entity contributed in the prior year (full or partial year) versus the current year (partial year to disposal or zero). A disposal creates a headwind in the current-year bridge that exactly offsets the prior-year contribution that no longer appears.
In practice, most consolidated bridges omit accounting changes as a separate category unless the impact is material. Restatements and policy changes are noted in the disclosure but absorbed into the opening or comparative figures rather than shown as a separate bridge movement.
Worked Example: Meridian Group Revenue Bridge
Meridian Group consists of three entities in the current year: Meridian UK (the parent, GBP), Nexus GmbH (Germany, EUR, 100% owned — full year both years), and Coastal BV (Netherlands, EUR, 100% owned — acquired 1 July current year, so H2 only in current year and absent in prior year).
| Entity | Scope | Prior Year Revenue £k | Current Year Revenue £k | Reported Movement £k |
|---|---|---|---|---|
| Meridian UK | Full year both years | 8,400 | 9,100 | 700 |
| Nexus GmbH | Full year both years (EUR) | 7,800 | 8,190 | 390 |
| Coastal BV | H2 current year only (acquired 1 Jul) | — | 4,350 | 4,350 |
| Consolidated revenue | 16,200 | 21,640 | 5,440 | |
The reported £5,440k increase (+33.6%) is dominated by Coastal BV’s first-half contribution. To decompose it, James applies the four-category framework. For Nexus GmbH, he needs the EUR revenue in both years and the exchange rates. Nexus earned €9,091k in the prior year (translated at 0.858 average → £7,800k) and €9,750k in the current year (translated at 0.840 average → £8,190k). The constant-currency current-year GmbH revenue (using prior-year rate) is €9,750k × 0.858 = £8,365k. This allows the organic and FX components to be separated.
Meridian Group — Revenue Bridge PY £16,200k → CY £21,640k
Prior year consolidated revenue£16,200k
Meridian UK — organic growth (full year, GBP)+£700k
Nexus GmbH — organic growth (constant currency: €9,750k vs. €9,091k, at PY rate 0.858)+£565k
Nexus GmbH — FX translation (€9,750k × rate change 0.858→0.840 = −0.018)−£175k
Coastal BV — acquisition contribution (H2 only, Jul–Dec)+£4,350k
Total movement+£5,440k
Current year consolidated revenue£21,640k
The bridge makes the NED’s question answerable. Of the £5,440k reported revenue growth: £1,265k (£700k + £565k) is organic at constant currency — a 7.8% organic growth rate. £175k is a FX translation headwind (Nexus GmbH’s EUR revenue in GBP terms is lower because of the EUR/GBP rate movement, even though the underlying EUR revenue grew). £4,350k is the acquisition contribution from Coastal BV. The 33.6% headline growth rate conceals a far more modest 7.8% organic growth story.
The EBITDA Bridge
The same decomposition applies to EBITDA, with an additional dimension: margin change. Organic EBITDA growth can come from volume (more revenue at the same margin) or from margin improvement (the same revenue at a better margin) — and boards typically want to understand both.
| Entity | PY EBITDA £k | PY Margin % | CY EBITDA £k | CY Margin % | Movement £k |
|---|---|---|---|---|---|
| Meridian UK | 1,680 | 20.0% | 1,820 | 20.0% | 140 |
| Nexus GmbH | 2,280 | 29.2% | 2,460 | 30.0% | 180 |
| Coastal BV | — | — | 1,630 | 37.5% | 1,630 |
| Consolidated EBITDA | 3,960 | 24.4% | 5,910 | 27.3% | 1,950 |
For the EBITDA bridge, Nexus GmbH’s movement of £180k reported requires the same EUR decomposition. Nexus earned €2,657k EBITDA at 29.2% margin in the prior year (£2,280k at 0.858). In the current year it earned €2,929k at 30.0% margin (£2,460k at 0.840). Constant-currency current-year EBITDA: €2,929k × 0.858 = £2,513k. Organic improvement (constant currency): £2,513k − £2,280k = £233k. FX impact: £2,460k − £2,513k = (£53k). Margin-only EBITDA gain (volume-neutral): €(2,929k − €2,657k × 30%/29.2%) × 0.858 — this level of decomposition is useful for detailed analysis but is typically presented at the organic total level in a board bridge rather than separated into volume and margin sub-components.
Meridian Group — EBITDA Bridge PY £3,960k → CY £5,910k
Prior year consolidated EBITDA£3,960k
Meridian UK — organic EBITDA improvement (flat margin × revenue growth)+£140k
Nexus GmbH — organic EBITDA improvement (constant currency)+£233k
Nexus GmbH — FX translation on EBITDA (EUR/GBP rate change)−£53k
Coastal BV — acquisition EBITDA contribution (H2, 37.5% margin)+£1,630k
Total EBITDA movement+£1,950k
Current year consolidated EBITDA£5,910k
The EBITDA bridge answers the NED’s question precisely: of the £1,950k improvement, £373k (£140k + £233k) is organic improvement at constant currency — a 9.4% organic EBITDA growth rate. £53k is a FX headwind. £1,630k is Coastal BV’s acquisition contribution. The 27.3% consolidated margin looks far better than the 24.4% prior-year margin — but this is almost entirely because Coastal BV operates at a 37.5% EBITDA margin, which pulls the consolidated margin up. On an organic-only basis, the consolidated margin was 24.5% in the current year versus 24.4% in the prior year — essentially flat at the continuing entities.
The bridge also exposes a structural shift in the group that the headline margin improvement conceals: Nexus GmbH’s margin improved from 29.2% to 30.0% in local currency — genuine operational improvement. Meridian UK’s margin was flat at 20.0%. The 37.5% margin of Coastal BV is structurally transforming the group’s consolidated margin profile, which has significant implications for how the group is valued and how future targets should be set. These are the conversations a well-prepared bridge enables.
The Full-Year Effect of Mid-Year Acquisitions
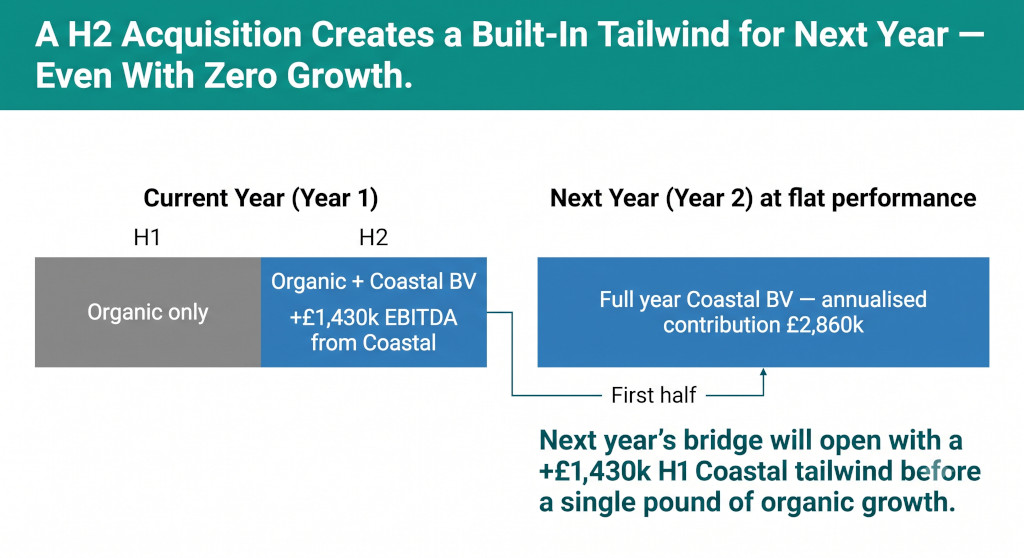
One of the most important — and most frequently overlooked — aspects of consolidated YoY comparison is the full-year effect of a mid-year acquisition. When Coastal BV was acquired on 1 July, it contributed six months of EBITDA (£1,630k) to the current year. In the following year, assuming flat performance, it will contribute twelve months — an annualised £3,260k. The H1 of next year (£1,630k) will appear in next year’s consolidated EBITDA without any organic trading improvement at Coastal, simply because the full-year contribution is twice the half-year contribution.
Coastal BV — Full-Year Effect in Next Year’s Bridge
Current-year contribution (H2, 6 months)£1,630k
Next-year contribution (full year, flat performance)£3,260k
Built-in H1 tailwind in next year’s bridge (additional H1 vs. prior year’s zero H1)£1,630k
Effective: next year’s consolidated EBITDA grows by £1,630k before any organic performanceBuilt-in uplift
This full-year effect is a structural tailwind — next year’s reported growth will include £1,630k of EBITDA growth simply from Coastal BV’s H1 contribution, which had no equivalent in the current year’s H1. If the board sets targets or assesses management performance against reported consolidated growth, this effect must be understood and disclosed. A target of “grow EBITDA by £1,000k next year” sounds ambitious — but it would be achieved entirely by the Coastal BV full-year effect even with zero organic improvement and a slight deterioration at the UK and German businesses.
The same logic applies in reverse to disposals. If a business is sold on 30 September, the current year loses the Q4 contribution. Next year loses the Q1–Q3 contribution as well — a structural headwind that appears in next year’s bridge even with no organic deterioration anywhere.
FX Translation: What Belongs in the Bridge and What Doesn’t
FX translation is a consolidation effect — it has nothing to do with how well the subsidiary is trading and everything to do with the movement of exchange rates between reporting periods. The key distinction is between translational FX (the subject of the consolidated bridge) and transactional FX (which appears in the entity’s own P&L and is already captured in the organic movement).
Translational FX arises when the GBP equivalent of a foreign subsidiary’s local-currency results changes because the exchange rate moved, even though the local-currency results are identical. Nexus GmbH earned €2,929k EBITDA in the current year. At the prior-year rate (0.858), this would be £2,513k. At the current-year rate (0.840), it is £2,460k. The £53k difference is a translational FX headwind — it does not reflect any change in Nexus’s actual performance.
Transactional FX is different. If Nexus purchases components in USD, the EUR cost of those components changed when the USD/EUR rate moved. That change flows through Nexus’s P&L in EUR and is already captured in the organic movement (Nexus’s EUR EBITDA already reflects whatever USD cost changes occurred). Do not separately strip out transactional FX in the consolidated bridge — it is a real operating cost and belongs in the organic component.
Constant-currency calculations must use the same prior-year average rate consistently. The FX bridge item is calculated by retranslating the current-year local-currency results at the prior-year average rate and comparing to the as-reported GBP figure. Some groups use the prior-year closing rate instead of the prior-year average rate, which produces a slightly different answer. Either is acceptable, but the same rate must be applied consistently across all entities and all line items in the bridge. Mixing average and closing rates across different entities in the same bridge produces inconsistent FX and organic splits that will not reconcile under scrutiny.
When Comparatives Have Been Restated
If prior-year comparative figures have been restated following a prior-period error (as described in How to Handle Prior-Period Adjustments in Consolidated Financial Statements), the YoY bridge must use the restated comparative as its starting point — not the originally reported figure. Any bridge that compares current year to the “as originally reported” prior year is comparing to a known-incorrect figure.
In practice, this means the bridge should be rebuilt after the comparative restatement is finalised, not before. A common mistake is to prepare the bridge against draft comparatives that are subsequently restated during the audit, producing a bridge that needs to be redone. For year-end board packs where comparatives are subject to audit adjustment, it is worth flagging to the board that the bridge is based on current best estimates of the comparative figures and may be revised if audit adjustments are made.
For boards that received the prior year’s results with the original (pre-restatement) figures, it is also good practice to include a brief reconciliation from the originally reported prior-year figure to the restated figure, as a separate disclosure, before presenting the current-to-prior bridge. This prevents confusion when the opening figure of the bridge does not match what the board saw in the prior year’s pack.
Practical Checklist: Consolidated YoY Comparison
- Identify every entity-level structural change between the two periods. List acquisitions (and their acquisition dates), disposals (and their disposal dates), and any changes in consolidation scope. Each structural change requires a separate bridge component — you cannot present a clean organic growth rate without first isolating the structural effects.
- Confirm that comparatives are the restated figures, not the originally reported figures. If any prior-period restatement has been made, ensure the bridge starts from the correct baseline. If the restatement occurred during the current period’s preparation, note it to the board and explain the effect on the comparison base before presenting the bridge.
- Calculate the constant-currency organic contribution for each continuing entity. For GBP entities, this is simply the current-year result. For EUR, AUD, or other foreign-currency entities, retranslate the current-year local-currency result at the prior-year average rate to get the constant-currency figure. The difference from the as-reported GBP figure is the FX component.
- Calculate the FX component as a separate bridge item. This is the retranslation difference: current-year local-currency result at prior-year rate minus current-year local-currency result at current-year rate. A weakening functional currency (EUR falls against GBP) produces a negative FX bridge item — even if the subsidiary’s EUR performance improved. Be explicit about the sign and direction when presenting to the board.
- Calculate the acquisition contribution as post-acquisition-date results only. For an entity acquired mid-year, the acquisition contribution in the bridge is only the months included in the current year’s consolidated results. Do not annualise. The full-year effect will appear in next year’s bridge as a structural tailwind.
- Calculate the disposal effect as the difference between prior-year and current-year contributions. A disposal creates a headwind equal to the prior-year contribution minus the partial current-year contribution (months up to disposal date). If the disposed entity was acquired during the prior year, use only the post-acquisition-date prior-year contribution as the comparison.
- Verify the bridge reconciles exactly to the reported figures. Organic + FX + Acquisition + Disposal = Reported movement. If the bridge does not foot, the most common causes are: failing to adjust the organic component for entities that were only partially present in the prior year, mixing constant-currency and current-year rates in the organic component, or including a mid-year acquisition in the “continuing entities” organic calculation rather than isolating it as an acquisition effect.
- Calculate and disclose the annualised run-rate of mid-year acquisitions. For any acquisition in the current year, calculate the annualised contribution (full-year equivalent EBITDA) and disclose it alongside the part-year contribution. This allows the board to assess the full-year effect in next year’s consolidated results and set appropriate targets that do not confuse structural tailwind with organic improvement.
- Present organic growth as the headline performance metric, with the full bridge as supporting detail. The board discussion should lead with the organic growth rate (constant-currency, continuing entities) as the measure of management’s operational performance. The bridge should be presented as the reconciliation from that organic performance to the reported consolidated result, showing the effect of each structural and FX component. This framing prevents the reported consolidated growth rate from being credited to or blamed on management’s operational decisions.
- Recheck the bridge when audit adjustments are made to the current or comparative year. Any audit adjustment that affects a consolidated figure — a consolidation error correction, a prior-period restatement, a reclassification — requires the bridge to be recalculated. The organic growth rate, in particular, can shift materially if an audit adjustment is allocated to one year’s figure and not the other. Always provide the final board with a bridge based on the final audited figures, not the pre-audit draft.
When James presented the decomposed bridge at the reconvened board meeting, the NED’s response was immediate: “So we grew organically by 7.8% on revenue and 9.4% on EBITDA at constant currency — and the margin improvement is almost entirely Coastal BV.” James confirmed it. The chief executive added that Nexus GmbH’s margin improvement from 29.2% to 30.0% in EUR terms was the most encouraging operational data point in the pack. None of that was visible from the headline consolidated figures. It had taken thirty minutes to build the bridge. It changed the entire character of the board discussion.
Your YoY bridge, built automatically from the consolidation
BrizoConsol tracks each entity’s contribution by period — organic, acquired, and disposed — so the YoY bridge is available as a live output from the close, not a manual exercise built the night before the board meeting. Constant-currency organic growth is calculated automatically from the entity-level results and the exchange rate inputs. See It In Action
Know your organic growth rate before the board asks for it
BrizoConsol decomposes consolidated movements into organic, acquisition, FX, and disposal components at every close — so the bridge is ready when the board pack is, not after it. Start free today. Start Free Trial