When Entities Code the Same Cost Differently: How Inconsistent Charts of Accounts Break Group Management Reporting
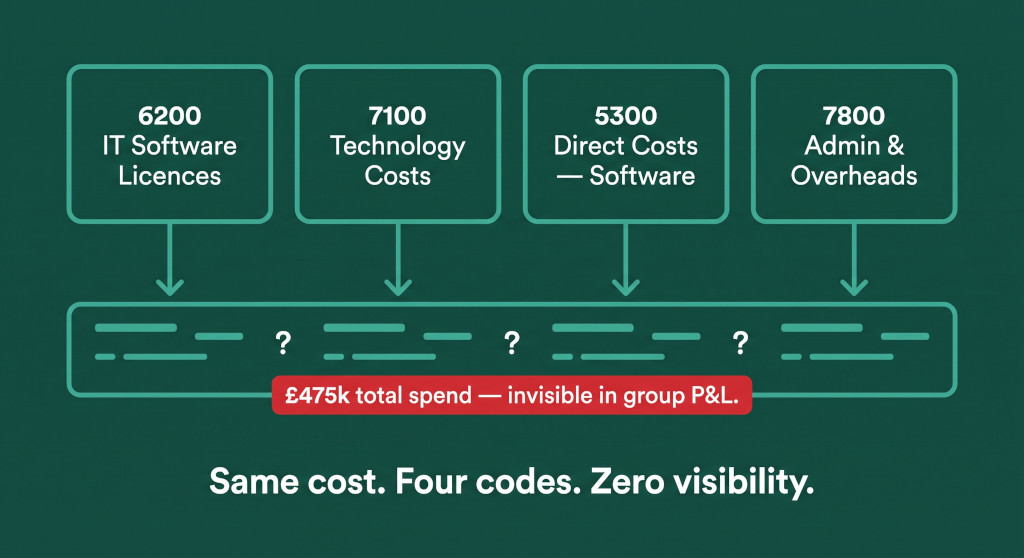
Rachel is the group finance manager at Vantage Group. Each of the group’s four entities runs Xero, set up independently when each business was acquired or incorporated. In the most recent month-end, Rachel compiled the consolidated management P&L and noticed something she had been half-aware of for months but had never been able to resolve: the group’s software and technology spend appeared in four completely separate lines, under four completely different headings, and the total was impossible to read from the consolidated P&L without manually adding them up from the entity breakdowns.
More concerning: Vantage Services — the entity whose MD had been pressing for a software rationalisation project — showed a gross margin of 58%, while Vantage HQ showed 72%. The MDs were comparing their margins in leadership meetings. But the comparison was meaningless. Vantage Services coded its software licences to a direct cost account, which reduced its reported gross profit. The other three entities coded identical software costs to overhead accounts, which sat below the gross profit line entirely. The entities were not on the same accounting basis. Their gross margins were not comparable.
This is what inconsistent account coding does in a multi-entity group. It does not create errors in any entity’s individual accounts — each entity is internally consistent and its own management reporting works fine. The damage emerges at consolidation, when costs that should belong to the same category are scattered across different accounts, above and below different subtotals, with no group-level visibility of the total.
Stop building consolidations in spreadsheets.
BrizoConsol automates multi-entity consolidation — setup in minutes, reports the same day.
Why This Is a Group-Only Problem
A single-entity business codes expenses however it chooses. If that entity codes software to “IT Software Licences” or “Technology Costs” or “Admin & Overheads,” its management reporting is still internally consistent — all software spend goes to one place. There is no second entity to code it differently, no consolidation layer where the two systems must reconcile, and no board trying to compare margins across business units that are using different accounting conventions.
In a multi-entity group, especially one that has grown through acquisition, the entities typically arrive with pre-existing charts of accounts configured by their previous finance teams, their bookkeepers, or the defaults of whatever accounting software they use. Xero, QuickBooks, and Sage all have different default account structures. Entities that have been set up at different times, by different people, for different purposes, will almost always have diverged — sometimes dramatically — in how they categorise the same type of cost.
Nobody designed this divergence. It happened gradually, entity by entity, each decision locally sensible. The problem only becomes visible when a group finance function tries to produce a consolidated management P&L that is coherent at the group level.
Vantage Group: How Four Entities Code the Same Cost
Vantage Group spends £475,000 per year on software licences and subscriptions — a material cost category that spans SaaS tools, ERP licences, productivity software, and cloud infrastructure. The four entities code this spend as follows:
Vantage HQ
Vantage Digital
Vantage Services
Vantage North
Each entity’s own management accounts are consistent. The problem is what happens when Rachel consolidates them.
Three Categories of Damage in the Consolidated P&L
1. Hidden Total Group Spend
In the consolidated P&L, Rachel sees the following software-related line items:
| Line in consolidated P&L | Amount (£) | Source |
|---|---|---|
| IT Software Licences | 85,000 | Vantage HQ only |
| Technology Costs | 220,000 | Vantage Digital only |
| Admin & Overheads | 342,000 (blended) | Vantage North software £30k pooled with other admin — cannot be isolated |
| Direct Costs — Software (in cost of sales) | 140,000 | Vantage Services — above GP line, in a different section of the P&L entirely |
A board member asking “what does the group spend on software?” cannot answer that question from this P&L. Three of the four amounts are visible but not labelled as the same category. The fourth (Vantage North) is pooled inside “Admin & Overheads” and cannot be extracted without going back to the entity’s own accounts. And Vantage Services’ £140,000 is sitting above the gross profit line in a different section of the P&L, where nobody is looking for software costs.
The total group software spend of £475,000 is material — over 8% of the group’s total operating cost base. It is invisible at the group level.
2. Distorted Gross Margin Comparisons Between Entities
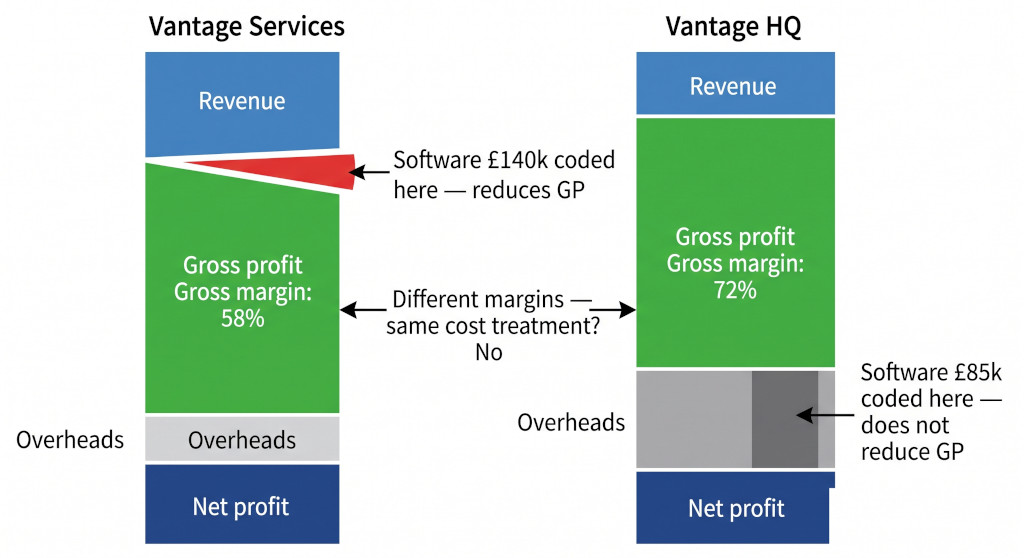
Vantage Services codes software to Account 5300 “Direct Costs — Software” — above the gross profit line. This means software costs reduce Vantage Services’ reported gross margin. The other three entities code software below the GP line, so their gross margins are not affected.
When Rachel presents entity gross margins side by side, the comparison is structurally invalid:
| Entity | Revenue (£) | Cost of Sales (£) | Gross Profit (£) | GP Margin | Software in GP? |
|---|---|---|---|---|---|
| Vantage HQ | 1,200,000 | 336,000 | 864,000 | 72.0% | No — in overheads |
| Vantage Digital | 2,800,000 | 952,000 | 1,848,000 | 66.0% | No — in overheads |
| Vantage Services | 1,600,000 | 672,000 | 928,000 | 58.0% | Yes — £140k in cost of sales |
| Vantage North | 800,000 | 248,000 | 552,000 | 69.0% | No — pooled in admin |
| Consolidated group | 6,400,000 | 2,208,000 | 4,192,000 | 65.5% | Mixed |
Vantage Services’ GP margin of 58% appears 8–14 percentage points below the other entities. If the leadership team interprets this at face value, they conclude that Vantage Services has a structurally weaker gross margin and begin investigating pricing, delivery efficiency, or cost controls. But if software were reclassified consistently — below the GP line, as the other entities treat it — Vantage Services’ gross margin would improve by approximately 8.75 percentage points to 66.8%: broadly in line with the group.
The margin gap is an accounting artefact, not a business reality. A management team that acts on it wastes time investigating a non-problem. A management team that doesn’t notice it is making strategic decisions on inaccurate data.
3. Incorrect Cost Category Benchmarking
When the group finance team benchmarks cost categories against budget — “are we over or under on IT spend?” — the inconsistent coding produces a false picture. “IT Software Licences” appears to be £85,000 (just Vantage HQ). “Technology Costs” appears to be £220,000 (just Digital). The actual group IT software spend of £475,000 is nowhere in the variance analysis. The group is spending almost 4x what the “IT Software Licences” line suggests — but the consolidated P&L gives no indication.
This matters more than it seems. Cost category benchmarking drives budgeting, procurement decisions, and vendor rationalisation. If the group decides to renegotiate its software contracts — a natural response to a perceived £220,000 IT spend — it may be negotiating only for Vantage Digital while the other three entities continue renewing independently. The group loses the negotiating leverage of its actual £475,000 spend because the finance function doesn’t know the total exists.
The consolidated P&L will not alert you to this problem. There is no error flag, no reconciling item, no warning. The P&L simply presents the fragmented cost categories as they are — coherent within each entity, incoherent across the group. The damage accumulates silently: management decisions made on incorrect data, entity comparisons drawn from incomparable bases, and spend categories that exist only inside individual Xero instances, never visible to the group.
The Group COA Mapping Layer: How to Fix It
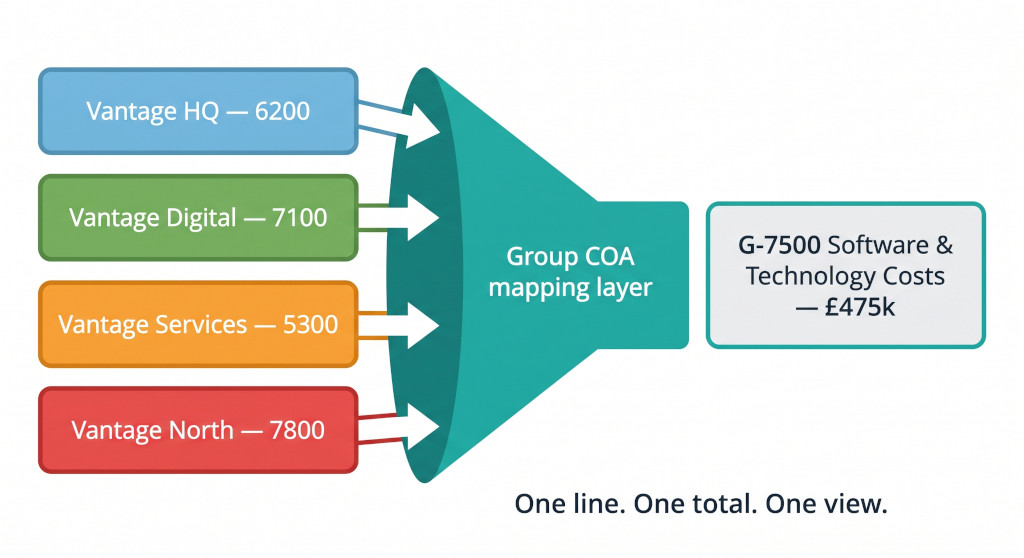
The solution is a group chart of accounts mapping layer — a translation table that maps every entity account code to a corresponding group account code. The entity-level accounts remain unchanged; each entity continues to code in its own Xero exactly as before, using the accounts that make sense for its own management reporting. The mapping layer converts entity codes to group codes at consolidation, so that the consolidated P&L reflects group-level categories rather than entity-level categories.
For Vantage Group’s software spend, the mapping looks like this:
After mapping, the consolidated P&L shows a single line “G-7500 Software & Technology: £475,000” — the complete group spend, visible in one place, comparable across entities, and usable for budgeting, benchmarking, and procurement decisions.
The Reclassification Problem: When Entity Coding Sits in the Wrong P&L Section
The Vantage Services situation — where software is coded above the GP line — requires more than a label remap. Moving a cost from “Direct Costs — Software” to “G-7500 Software & Technology” also needs to move it from cost of sales to operating expenses in the group P&L. This is a reclassification, not just a renaming.
The group finance team has two options:
- Reclassify in the mapping layer. At consolidation, map Vantage Services’ “Direct Costs — Software” to a group account that sits below the GP line. This produces a consistent consolidated gross margin. Entity-level reporting in Vantage Services’ own Xero remains unchanged, so its internal management reporting is not disrupted.
- Reclassify in Vantage Services’ chart of accounts. Ask Vantage Services to move the software account from cost of sales to overheads in its own Xero. This makes the entity’s own reporting consistent with the group standard and removes the need for a reclassification at consolidation. It requires the entity’s bookkeeper or finance team to update their nominal coding going forward.
The first option is faster and has no operational impact on the entity. The second is cleaner in the long run because it removes the reclassification from the consolidation process, reducing complexity and the risk of the adjustment being forgotten or misapplied. For a group with well-resourced entity finance teams, option two is preferable. For a group where entity bookkeeping is outsourced or minimally resourced, option one is more practical.
The Vantage North Pooling Problem
The Vantage North situation is different again. The software spend of £30,000 is pooled inside “Admin & Overheads” — an account that combines multiple cost types. There is no way to extract software spend from this account at consolidation without either splitting the account or going back to transaction-level data and re-coding it manually each month.
This is the most common and most intractable form of coding inconsistency: not just the wrong account, but the wrong level of granularity. The fix requires Vantage North to split “Admin & Overheads” into more specific accounts — “Software & Subscriptions,” “Office Costs,” “Professional Fees” — so that each cost type can be mapped separately to the group COA. This is a structural change to Vantage North’s chart of accounts, not just a remapping.
The practical approach for most groups is to prioritise: identify which cost categories are material enough to warrant granular tracking at entity level, and request that entity finance teams add specific accounts for those categories. Software spend at £30,000 annually may be borderline. At £300,000 it would not be. The group finance team sets the threshold; the entity finance teams implement the account additions.
What a Consistent Group COA Produces
After applying the mapping layer and the Vantage Services reclassification, the consolidated P&L for Vantage Group shows:
| Entity | Revenue (£) | Cost of Sales (£) | Gross Profit (£) | GP Margin | Change |
|---|---|---|---|---|---|
| Vantage HQ | 1,200,000 | 336,000 | 864,000 | 72.0% | Unchanged |
| Vantage Digital | 2,800,000 | 952,000 | 1,848,000 | 66.0% | Unchanged |
| Vantage Services | 1,600,000 | 532,000 | 1,068,000 | 66.8% | ↑ from 58% — software reclassified below GP |
| Vantage North | 800,000 | 248,000 | 552,000 | 69.0% | Unchanged |
| Consolidated group | 6,400,000 | 2,068,000 | 4,332,000 | 67.7% | ↑ from 65.5% — consistent basis |
And the consolidated operating expenses now show a single software line:
| Group account | Amount (£) | Entities contributing |
|---|---|---|
| G-7500 Software & Technology Costs | 475,000 | All four entities — fully consolidated |
The group finance team can now answer the software spend question in seconds. The entity gross margins are on a consistent basis and can be compared meaningfully. The budget variance for software can be tracked at group level and broken down by entity. The procurement team has a £475,000 spend figure to take to vendor negotiations.
The group COA mapping layer does not require entities to change their internal accounting. It operates at the consolidation layer, translating entity codes to group codes before the consolidated P&L is produced. Entities continue using the accounts that work for their own reporting; the group gets the consistency it needs. The only exception is when costs are pooled at the wrong level of granularity — that does require an entity-side account change, targeted at the specific categories that matter for group reporting.
Building and Maintaining the Mapping Table
The mapping table is the engine of a consistent group COA. It should list every entity account code, the entity it belongs to, and the group account code it maps to. For a group with four entities each running 150–200 nominal accounts, the initial mapping exercise typically takes a day to a week depending on the degree of divergence between the entity COAs. The output is a spreadsheet or database table — entity, entity code, entity account name, group code, group account name — that is applied at every consolidation.
Maintenance is ongoing. When an entity adds a new account — a common occurrence when a new cost type is first encountered — the new account appears as an unmapped item in the next consolidation. The group finance team must review unmapped accounts each period and add them to the mapping table. This is a light-touch ongoing task if done monthly; it becomes a significant cleanup exercise if allowed to accumulate across quarters.
The mapping table should also record the P&L section for each group account — revenue, cost of sales, gross profit, operating expenses, finance costs — so that reclassifications like the Vantage Services software account are captured explicitly rather than inherited from the entity’s original section placement.
For the structural design principles behind a group chart of accounts — how many account levels to use, how to handle segment reporting, and how to version-control the group COA as the group structure changes — see How to Design a Common Chart of Accounts for Multi-Entity Groups: A Step-by-Step Strategy Guide. For how AI-assisted account mapping can accelerate the initial mapping exercise for groups with large or divergent entity COAs, see AI Auto-Map Explained: How BrizoConsol Automatically Maps Entity Accounts to Your Group Chart of Accounts.
Map every entity account to the group COA — automatically
BrizoConsol’s mapping layer translates entity account codes to group codes at consolidation, so your management P&L shows consistent categories across all entities — even when each entity’s Xero is set up differently.See It in Action