Why the Consolidated Gross Margin Fell When Every Entity Improved: The Entity Mix Variance in Multi-Entity Groups
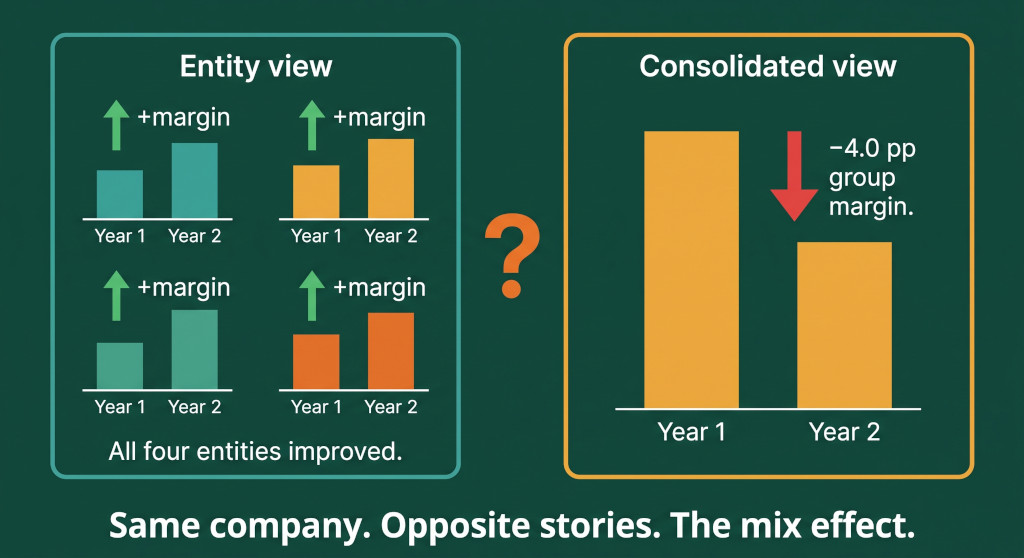
At the January board meeting, Sophie — group FD of Meridian Group — presented the Year 2 consolidated results. Gross margin had fallen from 52.5% to 48.5%: a four percentage point decline that was immediately flagged by the non-executive directors as a concern.
Sophie had spent the previous week preparing for this question. She had reviewed the management accounts for all four entities — Services, Distribution, Manufacturing, and Tech Licensing — and found the same thing in each one: every entity had held or improved its gross margin in Year 2 compared to Year 1. Services improved from 65% to 66%. Distribution improved from 28% to 29%. Manufacturing improved from 42% to 43%. Tech Licensing improved from 72% to 73%. Not one business unit had underperformed on margin.
And yet the consolidated gross margin had fallen four points. The board was looking at a decline that existed nowhere in the entities’ own accounts. It had emerged entirely at the consolidation level — the result of a shift in which entities contributed more or less revenue in Year 2 compared to Year 1.
Stop building consolidations in spreadsheets.
BrizoConsol automates multi-entity consolidation — setup in minutes, reports the same day.
This is entity mix variance: a consolidated margin movement caused not by changes in the margin of any individual entity but by a shift in the revenue weighting between entities with different margin profiles. It is a purely group-level phenomenon. It cannot be found in any entity’s P&L. It only becomes visible when you consolidate.
Why a Single Entity Can Never Experience Mix Variance
A single-entity business has one gross margin. If its revenue grows, its GP grows in proportion. If its margin improves or deteriorates, the cause is always found in that entity’s own cost structure, pricing, or product mix. There is no second entity to create a weighting effect.
In a multi-entity group, the consolidated gross margin is a weighted average of all entities’ margins, weighted by each entity’s share of group revenue. When one entity grows faster than others, its margin weight increases. If that entity happens to have a lower margin than the group average, its higher weighting pulls the blended consolidated margin down — even if the entity’s own margin held steady or improved. The consolidated metric moves in the opposite direction to the entity-level metric, and no entity-level review reveals why.
This is what creates the scenario Sophie faced: four entities each reporting margin improvement, and a consolidated margin that fell. The explanation is not a failure of any entity; it is a structural consequence of group composition and revenue mix.
Meridian Group: The Numbers
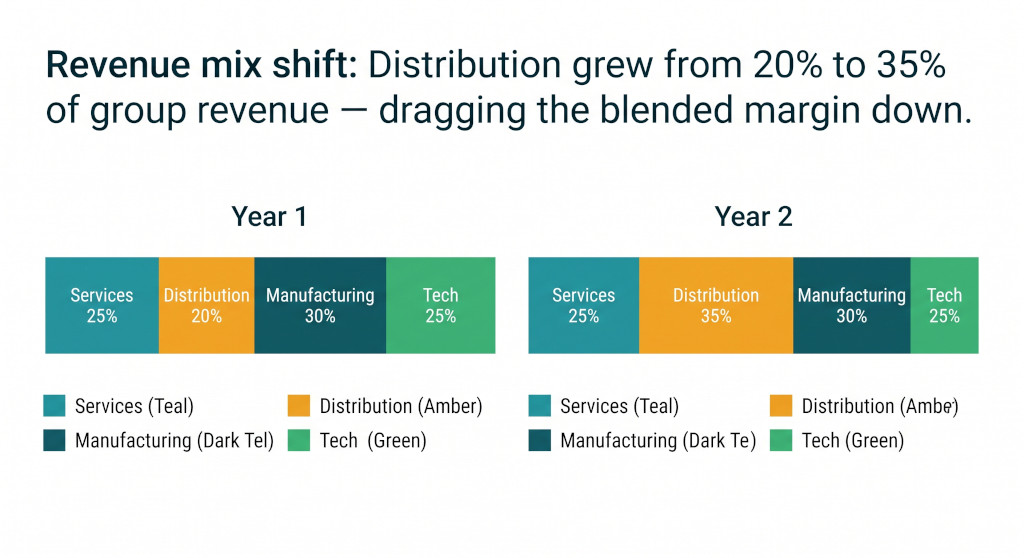
Meridian Group comprises four entities with materially different gross margin profiles: a professional services arm (high margin), a distribution business (low margin), a manufacturing subsidiary (mid margin), and a tech licensing entity (highest margin). In Year 1, revenue was roughly balanced across the four. In Year 2, the distribution subsidiary won a large new contract, and its revenue grew significantly — from £2.0m to £3.8m — while the other entities grew modestly.
| Entity | Y1 Revenue (£) | Y1 Margin % | Y1 Gross Profit (£) | Y1 Rev Mix |
|---|---|---|---|---|
| Meridian Services | 2,500,000 | 65% | 1,625,000 | 25.0% |
| Meridian Distribution | 2,000,000 | 28% | 560,000 | 20.0% |
| Meridian Manufacturing | 3,000,000 | 42% | 1,260,000 | 30.0% |
| Meridian Tech Licensing | 2,500,000 | 72% | 1,800,000 | 25.0% |
| Group consolidated | 10,000,000 | 52.5% | 5,245,000 | 100% |
| Entity | Y2 Revenue (£) | Y2 Margin % | Y2 Gross Profit (£) | Y2 Rev Mix |
|---|---|---|---|---|
| Meridian Services | 2,200,000 | 66% ↑ | 1,452,000 | 20.0% |
| Meridian Distribution | 3,800,000 | 29% ↑ | 1,102,000 | 34.5% |
| Meridian Manufacturing | 2,900,000 | 43% ↑ | 1,247,000 | 26.4% |
| Meridian Tech Licensing | 2,100,000 | 73% ↑ | 1,533,000 | 19.1% |
| Group consolidated | 11,000,000 | 48.5% ↓ | 5,334,000 | 100% |
Every entity improved its margin. Group revenue grew by £1,000,000 (10%). Group gross profit grew in absolute terms by £89,000 — but on the higher revenue base, the group gross margin fell from 52.5% to 48.5%. The four percentage point decline is entirely explained by the mix shift: Meridian Distribution’s revenue share grew from 20.0% to 34.5%, and at 28%–29% margin it is the lowest-margin entity in the group by a significant distance. Its larger weighting dragged the blended consolidated margin down despite its own margin improving.
Decomposing the Consolidated Margin Variance into Three Components
When presenting this variance to the board, Sophie needs to decompose the total consolidated GP movement (−£89,000 in margin-point terms, or −4.0pp in margin rate terms) into three distinct effects so that the board can understand what drove it. The three components are:
- Volume effect — the additional GP the group would have generated if revenue grew at the same rate in every entity, maintaining Year 1 margins and Year 1 mix. This is always positive when revenue grows and reflects scale.
- Rate effect — the GP improvement (or deterioration) caused by each entity changing its own gross margin rate. Since every Meridian entity improved its margin in Year 2, the rate effect is positive for all four.
- Mix effect — the GP impact of shifting revenue weighting between entities with different margins. This is the pure group-level effect. It captures the consequence of one entity growing faster than others and changing the blended consolidated average.
The decomposition is calculated as follows:
Volume Effect
Apply Year 1 margin and Year 1 mix to the Year 2 revenue total. This gives the GP the group would have earned if it had simply grown all entities proportionally at prior-year margins: £11,000,000 × 52.5% = £5,775,000. Versus Year 1 actual GP of £5,245,000, the volume effect is +£530,000. This reflects the benefit of growing a £10m group to £11m.
Rate Effect
Apply Year 2 actual margins to Year 2 actual revenues, then compare to the same revenues at Year 1 margins. This isolates the pure margin improvement within each entity:
| Entity | Y2 Revenue (£) | Y1 Margin | GP at Y1 Margin (£) | Y2 Margin | GP at Y2 Margin (£) | Rate Effect (£) |
|---|---|---|---|---|---|---|
| Services | 2,200,000 | 65% | 1,430,000 | 66% | 1,452,000 | +22,000 |
| Distribution | 3,800,000 | 28% | 1,064,000 | 29% | 1,102,000 | +38,000 |
| Manufacturing | 2,900,000 | 42% | 1,218,000 | 43% | 1,247,000 | +29,000 |
| Tech Licensing | 2,100,000 | 72% | 1,512,000 | 73% | 1,533,000 | +21,000 |
| Total rate effect | +110,000 |
Mix Effect
This is the residual — the GP that would have been earned at Year 1 mix and Year 1 margins on Year 2 total revenue (£5,775,000), minus the GP actually earned at Year 2 actual entity revenues and Year 1 margins (£5,224,000). The difference of −£551,000 is the mix penalty: the cost, in gross profit terms, of having Meridian Distribution grow disproportionately fast relative to the higher-margin entities.
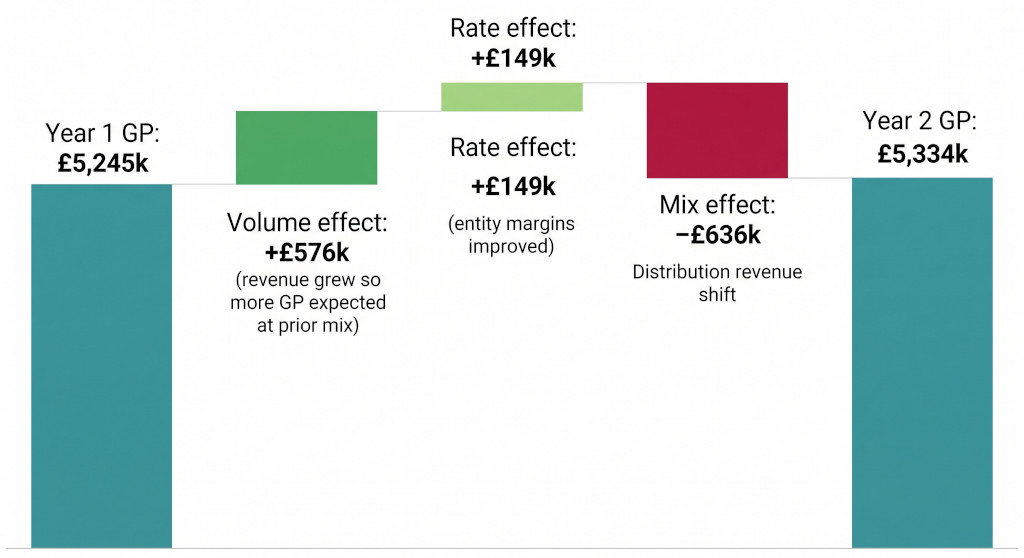
The bridge makes the situation immediately legible: the group earned more gross profit in absolute terms (£5,334,000 versus £5,245,000) as a result of strong volume growth and universal entity-level margin improvement. But the mix effect of Distribution’s growth was large enough to overwhelm those gains in margin percentage terms, pulling the consolidated rate from 52.5% to 48.5%. The group did not underperform. The mix shifted.
The three-way decomposition — volume, rate, mix — is the tool that separates “the group performed badly” from “the group grew in a way that diluted the blended margin.” Without it, a board reading a consolidated P&L sees a margin decline and no entity-level evidence of what caused it. With it, they see that entity performance was universally positive and the consolidated margin movement was structural, not operational.
Why the Mix Effect Is Invisible in Entity Accounts
The mix effect does not appear in any entity’s P&L — not in Meridian Distribution’s, which grew and improved its own margin; not in Meridian Services’, which experienced revenue decline and margin improvement; and not in any of the other two. Each entity’s management accounts show the entity’s own revenue and margin, with no reference to what is happening to the group-level blended average. The entity MD reviewing their own accounts has no visibility of the mix shift — and correctly so, since the entity’s own performance was good.
This creates a common and frustrating dynamic in board reporting. The entity MDs present their individual performance and are satisfied. The group FD presents the consolidated results and faces a difficult question. No one is wrong about their own numbers. The disconnect emerges because the consolidated metric — blended margin — is a property of the group composition, not a property of any entity.
A group controller investigating a consolidated margin variance who looks only at entity-level accounts will find no explanation. The explanation is found by comparing entity-level revenue mixes between periods — information that is only available at the consolidation level, from a report that shows all entities’ revenues alongside one another.
How to Present Entity Mix Variance to the Board
Sophie’s presentation of this variance to the board has three parts: the entity performance table (showing each entity’s margin improved), the revenue mix comparison (showing how Distribution’s share grew), and the three-way GP bridge (showing what the mix effect cost in GP terms). Together, the three elements tell a complete and coherent story.
The narrative that accompanies the tables should be concise and direct. Something like: “Consolidated gross margin fell 4.0 percentage points to 48.5%, but this reflects a shift in revenue mix rather than any deterioration in entity performance. Every entity improved its margin in the year. The Distribution business won a significant new contract and grew revenue by 90% — its share of group revenue increased from 20% to 35%. Distribution operates at a structurally lower margin than the rest of the group, and its higher revenue weighting reduced the consolidated blended margin. This was offset in part by a £110k improvement in rate across all entities and a £530k volume benefit from group revenue growth.”
The key phrase is “shift in revenue mix rather than any deterioration in entity performance.” This directly addresses the question the board is asking — is there a problem? — without requiring them to work through the numbers themselves.
What the Board Should Then Ask
A board that has understood the mix effect will typically ask two follow-up questions: Is the Distribution contract margin-dilutive by design — i.e., was this a deliberate decision to win volume at a lower margin — or is Distribution expected to improve toward group margin levels over time? And second: at what point does Distribution’s revenue share become a structural shift in what kind of group this is, requiring a reassessment of the group’s blended margin target?
Both are legitimate strategic questions. The variance analysis does not answer them, but it frames them correctly. Without the three-way decomposition, the board is asking the wrong question — why did the group underperform? — and Sophie has nothing to show them that explains the disconnect between entity performance and consolidated results.
Calculating the Mix Effect: The Mechanics
The mix effect is calculated by holding margins constant at Year 1 rates and comparing what the GP would have been at Year 1 revenue mix (applied to Year 2 total revenue) versus what it actually was at Year 2 revenue mix (with Year 1 margins):
| Entity | Y2 Total Rev applied at Y1 mix % | GP at Y1 mix & Y1 margin (£) | Y2 Actual Rev | GP at Y2 actual mix & Y1 margin (£) | Mix Effect (£) |
|---|---|---|---|---|---|
| Services (Y1 mix 25%) | 2,750,000 | 1,787,500 | 2,200,000 | 1,430,000 | −357,500 |
| Distribution (Y1 mix 20%) | 2,200,000 | 616,000 | 3,800,000 | 1,064,000 | +448,000 |
| Manufacturing (Y1 mix 30%) | 3,300,000 | 1,386,000 | 2,900,000 | 1,218,000 | −168,000 |
| Tech Licensing (Y1 mix 25%) | 2,750,000 | 1,980,000 | 2,100,000 | 1,512,000 | −468,000 |
| Total mix effect | 11,000,000 | 5,769,500 | 11,000,000 | 5,224,000 | −545,500 |
The mix effect (−£545,500, approximately −£551,000 with rounding) is the GP penalty from the revenue weighting shift. Distribution grew — which added GP — but Services and Tech Licensing (the highest-margin entities) shrank as a proportion of the group, and the GP that would have been earned at those higher margins was lost to the mix shift. The net effect is the balance of these movements and is always calculable as the sum of entity-level mix contributions.
Common error: treating mix variance as a performance problem. The most frequent mistake in presenting consolidated variance analysis is attributing a mix-driven margin decline to management performance — implying the group has an efficiency problem, a pricing problem, or a cost control problem. The three-way decomposition prevents this: it proves the rate effect (entity-level performance) was positive, and the margin decline was structural. Presenting a mix variance without the decomposition creates reputational risk for the finance function and can lead the board to draw incorrect conclusions about the operating businesses.
When Mix Variance Becomes a Strategy Conversation
Not all mix variance is neutral. If the group’s strategy involves maintaining a minimum consolidated margin — for covenant compliance, for investor returns, or to fund a central overhead structure — then a structural shift toward lower-margin entities is a strategic question, not just a reporting one. At what blended margin does the central cost base become unaffordable? Is the Distribution growth diluting margin in a way that will be corrected as the contract matures, or is this a permanent feature of the revenue mix?
The variance analysis creates the data for that conversation. A group FD who can show the board a clean three-way decomposition — volume, rate, mix — with projected forward-looking mix percentages under different revenue scenarios is in a position to turn a reactive “why did the margin fall?” question into a proactive strategy discussion about what the group is willing to trade in margin terms for revenue growth.
For how to frame this kind of analysis in the board pack alongside other consolidated variances, see Group Variance Dashboard: How Multi-Entity Finance Teams Investigate Consolidated Results That Miss Budget. For the investigation workflow when consolidated results differ from the sum of entity budgets, see Group Reporting Software: Master Variance Analysis Across Entities.
See which entities are driving consolidated margin — instantly
BrizoConsol shows the revenue mix and blended margin contribution of every entity in the group, so you can identify mix variance before the board meeting — not during it.See It in Action