Group Variance Dashboard: How Multi-Entity Finance Teams Investigate Consolidated Results That Miss Budget
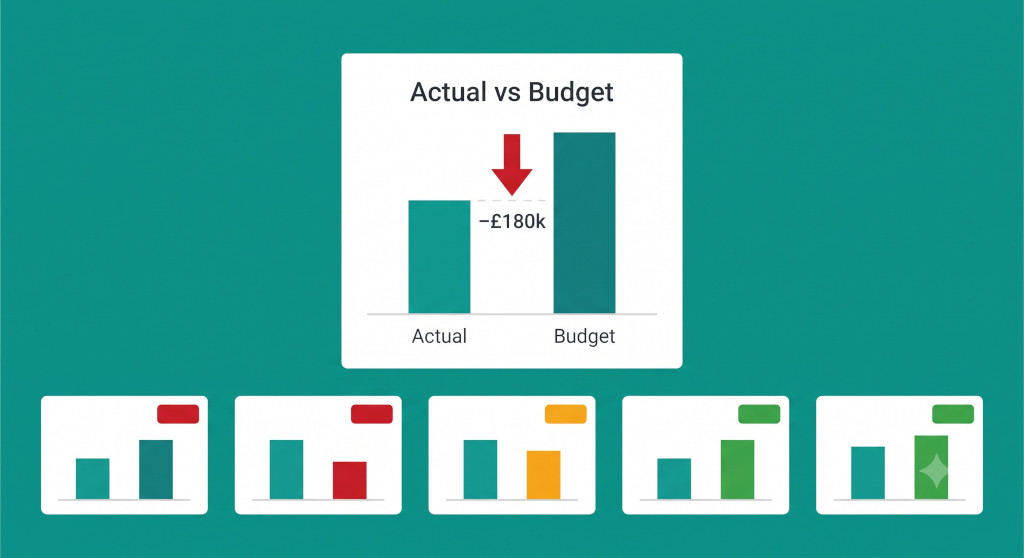
The board pack went out on a Thursday. By Friday morning, the CFO had three questions in her inbox. Consolidated revenue was £180,000 below budget for the month. Which entity was responsible? Was it one miss or spread across the group? And had the pattern started in prior months, or was this the first sign?
Daniel, the group controller, knew the consolidated figure was correct — he had closed the books the day before. What he did not know, without opening six separate entity reports and working through them manually, was the answer to any of the CFO’s questions. He spent most of Friday doing exactly that. By the afternoon he had a clear picture: the miss was almost entirely in one entity, driven by two lost contracts in the second week of the month, visible in the revenue line from week two onwards. The CFO got her answer at 4pm.
The consolidated number had appeared in the board pack on Thursday morning. The explanation arrived nine hours later. In a well-run group with a proper variance dashboard, the same explanation should have been visible in thirty seconds — not after a day of manual entity-level investigation.
Stop building consolidations in spreadsheets.
BrizoConsol automates multi-entity consolidation — setup in minutes, reports the same day.
The Variance Investigation Problem in Multi-Entity Groups
Consolidated financials are, by design, a summary. The process of consolidating six entities into one set of group accounts compresses a large amount of entity-level detail into a single P&L line. When that line hits budget, the summary is all the CFO needs. When it misses, the summary becomes a starting point rather than an answer — and the work of finding the answer begins.
In a single-entity business, this investigation is straightforward: one P&L, one set of transactions, one entity manager to call. In a multi-entity group, the investigation has a structural problem. The consolidated miss might be evenly spread across six entities, concentrated in one, caused by an intercompany timing difference that nets to zero at period-end but creates noise within the period, or distorted by a currency movement that has nothing to do with trading performance. Before the CFO can act on a budget miss, the finance team needs to disaggregate the consolidated variance into its component parts.
Without a variance dashboard that does this automatically, the investigation is manual: open each entity’s report, extract the relevant line, compare to that entity’s budget, aggregate by hand. For a six-entity group this might take two to four hours. For a twelve-entity group with multiple currencies it might take a full day. And the answer is only as reliable as the manual extraction process — which is itself prone to the errors that the consolidation was supposed to eliminate.
The variance investigation is not a sign of a poor consolidation. A consolidated figure that misses budget is valuable information. The problem is how long it takes to act on it — and a group variance dashboard cuts that time from hours to seconds.
What a Group Variance Dashboard Must Show
A group variance dashboard for budget investigation has a different structure from the performance monitoring dashboard the CFO looks at daily. The monitoring dashboard answers “how are we doing?” The variance dashboard answers “why did we miss, and where?” These are different questions with different data requirements.
At the group level, the variance dashboard needs to show actual versus budget for each headline metric — revenue, gross margin, operating cost, EBITDA — with the absolute and percentage variance for the current month and year to date. This is the layer the CFO reads first: which lines are in variance and by how much.
At the entity contribution layer, it shows how each entity contributed to the group variance on each line. This is where the investigation begins: if group revenue is £180,000 below budget, the entity contribution layer shows how much of that miss comes from each subsidiary. A CFO who can see that £155,000 of the £180,000 miss is from one entity can have one targeted conversation rather than six.
At the transaction layer, drilling into the entity that is driving the variance shows the specific accounts, cost centres, or transactions that explain the entity’s miss. This is where the investigation ends: a specific contract not renewed, a specific cost overrun, a specific timing difference that will reverse next month.
Our guide to mastering variance analysis across entities covers the analytical framework behind this in depth. The dashboard is the tool that makes that framework actionable within a reporting session rather than after a day of offline investigation.
How to Structure the Variance Layer of a Group Dashboard
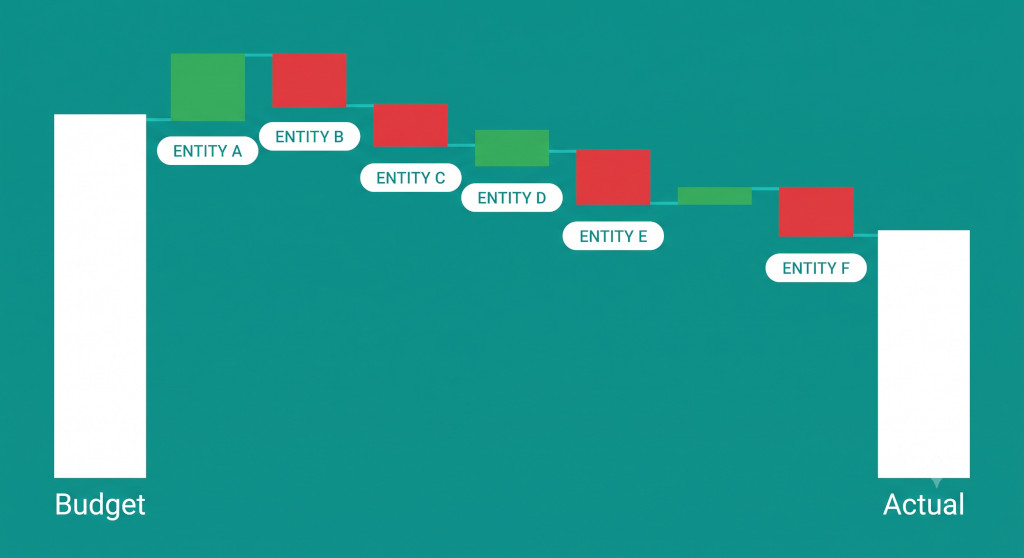
The most useful visual format for a group variance dashboard at the entity contribution layer is a waterfall chart that decomposes the group variance into entity contributions. The chart starts at budget, adds or subtracts each entity’s contribution to the variance, and ends at actual. An entity that beat budget appears as a green column adding value to the bridge. An entity that missed appears as a red column subtracting from it.
The worked example below shows how this looks in a five-entity group where consolidated revenue missed budget by £180,000 for the month.
| Entity | Budget Revenue | Actual Revenue | Variance | % Variance |
|---|---|---|---|---|
| Entity A (UK) | £620,000 | £641,000 | +£21,000 | +3.4% |
| Entity B (UK) | £480,000 | £475,000 | −£5,000 | −1.0% |
| Entity C (Australia, GBP equiv.) | £310,000 | £156,000 | −£154,000 | −49.7% |
| Entity D (UK) | £290,000 | £308,000 | +£18,000 | +6.2% |
| Entity E (UK) | £200,000 | £220,000 | +£20,000 | +10.0% |
| Group consolidated | £1,900,000 | £1,800,000 | −£180,000 | −9.5% |
The waterfall immediately tells the story that the manual investigation would have taken hours to find: the group miss of £180,000 is almost entirely attributable to Entity C, which missed its budget by £154,000 — nearly 50%. Entities A, D, and E actually beat budget. Entity B had a minor miss. Without the entity contribution layer, the CFO sees a 9.5% group revenue miss. With it, she sees that four of five entities are performing at or above budget, and one entity has a serious problem that needs immediate attention.
Watch out for currency noise in multi-currency groups. Entity C’s £154,000 miss might be partly a trading miss and partly a translation effect — if the AUD weakened against GBP during the month, the GBP equivalent of Entity C’s AUD revenue falls even when its trading performance was on budget. A proper variance dashboard separates these two effects so the CFO can distinguish a genuine trading miss from an FX movement before acting on it.
From Group Variance to Transaction: The Drill-Down Path
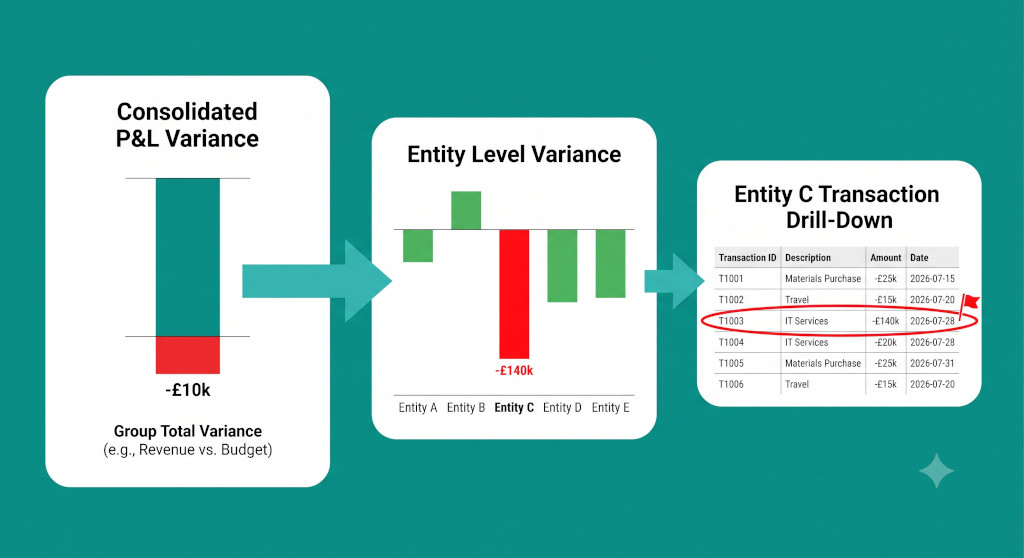
The entity contribution layer answers “which entity?” The transaction layer answers “why?” These are both questions the CFO will ask, in that order, within the same reporting conversation. A variance dashboard that can only answer the first question forces an offline investigation to answer the second — which reintroduces exactly the manual work the dashboard was supposed to eliminate.
BrizoConsol’s drill-down capability is built for this sequence. From the consolidated group variance, the finance director clicks into Entity C’s contribution. From Entity C’s contribution, they click into the revenue line. The system shows the detailed revenue breakdown for the period — by account, by cost centre, by transaction — and the comparison to budget at that level of granularity. The two lost contracts that drove the miss are visible in the transaction detail without a phone call to Entity C’s finance manager or a manual pull from the entity’s accounting system.
This changes the rhythm of the post-close conversation. Instead of the CFO asking a question at board level and the finance team spending a day finding the answer, the finance team arrives at the board conversation with the answer already in hand — visible in the variance dashboard before the meeting starts. The board discussion moves from “what happened?” to “what are we doing about it?” — which is where it should be.
See group variance drill-down on your actual data
Connect your entities and see a consolidated variance view — actual vs budget, entity contribution, and transaction-level drill-down — without a day of manual entity investigation.See It In Action
The Four Variance Types That Need Different Responses
Not all budget variances in a multi-entity group are the same problem. A group variance dashboard is most useful when it helps the finance team categorise the variance type quickly, because the appropriate response depends on which type it is.
Trading variance
The entity won or lost more revenue from third-party customers than budgeted. This is the variance type that requires a commercial response — a conversation with the entity’s sales or operations team about what changed and whether it is recoverable. It is visible in the external revenue line and should not be confused with intercompany movements.
Intercompany timing variance
An intercompany recharge between two entities was recorded in different periods at each end. This creates a variance that appears real but will net to zero once both entities have closed — or once the intercompany reconciliation is complete. A variance dashboard connected to the consolidation system can flag these automatically, because the elimination will catch the mismatch. Our guide to why intercompany balances never match covers the underlying causes in detail.
Currency translation variance
A foreign currency entity hit its local-currency budget but the translation to group reporting currency produced a different GBP figure because the rate moved. This is not a trading miss — it is an FX exposure. The right response is a treasury conversation, not a commercial one. A variance dashboard in a multi-currency group should split the entity variance into a local-currency trading component and a translation component so the two are not conflated. For the technical treatment of how this works under different standards, see our guide to currency translation under IAS 21, ASC 830, and FRS 102.
Timing variance
Revenue or cost that was budgeted in one period was recognised in a different period for legitimate accounting reasons — contract milestones, accruals, the timing of a service delivery. This variance will self-correct over the year and does not require a commercial response. Distinguishing it from a genuine trading miss is one of the most valuable things a variance dashboard can do, because the management response to a timing difference is patience, while the response to a trading miss is action.
What to Show the CFO vs What to Show the Board
The variance dashboard the finance team uses to investigate a consolidated miss is not the same view the CFO takes into a board meeting. The finance team needs transaction-level detail. The board needs a clear narrative supported by the minimum data required to understand the position and the response.
The board-level variance summary has three components: the headline group variance by key metric, the entity contribution waterfall that identifies the source, and a one-paragraph explanation of the primary driver and the management response. Everything else belongs in the appendix or in the finance team’s working papers. A board that receives a twelve-page variance analysis for a single missed metric has been given more information than it can act on — and less of a clear narrative than it needs.
For a full treatment of what belongs in the board reporting layer and how to structure it, see our guide to board reporting for multi-entity groups. Our post on how to explain consolidated variances to management covers the narrative layer — how to translate the variance data into a communication that drives a decision rather than prompting more questions.
Building the Variance Layer Into Your Group Dashboard: A Checklist
- Set budget data at entity level, not just group level. A group variance dashboard can only produce an entity contribution waterfall if each entity’s budget was entered at the same level of granularity as the actuals. If the budget exists only at group level — a common shortcut that finance teams later regret — the waterfall cannot be built. Each entity needs its own budget, set before the year begins.
- Separate intercompany revenue from external revenue in both actuals and budget. The variance analysis is only meaningful if it compares like with like. If Entity A’s actuals include intercompany revenue but its budget did not, the variance will show a fictitious positive. The consolidation system should track external and intercompany revenue separately so the variance dashboard can present clean external-only comparisons.
- Identify the FX effect before presenting the trading variance. For any entity reporting in a foreign currency, calculate the translation effect separately. Show the local-currency variance first (trading performance), then the translation effect (FX exposure), then the combined GBP variance. This prevents a currency movement from being misread as a trading problem — or vice versa.
- Build the drill-down path before the board meeting, not during it. The variance dashboard should be interrogated by the finance team before the CFO sees the numbers. Arrive at the board conversation knowing not just that Entity C missed by £154,000, but why — which accounts, which contracts, which weeks of the period. The drill-down is the finance team’s preparation tool, not an in-meeting investigation.
- Flag intercompany timing items explicitly. Any variance that you know will reverse when the intercompany reconciliation closes should be flagged in the dashboard as “timing — IC” rather than presented as a trading variance. This prevents management from acting on a variance that does not require action. See our guide to intercompany reconciliation for how to close these items faster.
- Include year-to-date alongside current month. A single-month miss may be a timing difference. A year-to-date miss of the same magnitude is a trend. Both belong in the variance dashboard, and the comparison between them often tells the most important part of the story before any drill-down is required.
Daniel’s Friday afternoon investigation — the one that took nine hours — was not a failure of effort or capability. It was a structural problem: the group had a consolidated P&L but no variance dashboard that connected the consolidated number to its entity-level components. Once the variance layer was built into the group reporting tool, the same investigation took four minutes. The CFO got her answer before lunch, not at the end of the day. The board conversation the following week was about the two lost Entity C contracts and the recovery plan — not about where the £180,000 had come from.
Start your free trial — variance drill-down included
BrizoConsol consolidates your entities, tracks actual vs budget at entity level, and lets you drill from the group variance to the transaction that explains it — in one tool, without a day of manual investigation. Start Free Trial