When the Group Structure Changed Mid-Year: How to Present Prior Period Comparatives in a Multi-Entity Board Pack That Don’t Mislead
Natalie is the group CFO of Beacon Group. In July 2024, the group completed the acquisition of Beacon Digital Ltd — a digital marketing subsidiary that generates around £2,600,000 in annual revenue. In the first full board pack of 2025, Natalie presented the year-end consolidated results for the year ended 31 December 2024, with 2023 figures in the comparative column.
Consolidated revenue for 2024 was £9,200,000, up from £8,000,000 in 2023 — an increase of £1,200,000, or 15%. The board was pleased. In the room, one non-executive director asked whether the underlying business had genuinely grown by 15% or whether the growth figure was partly the result of owning Beacon Digital for the second half of the year. Natalie confirmed the latter — Beacon Digital contributed £1,200,000 in its six months of ownership in 2024, meaning the legacy businesses had grown by approximately zero on a like-for-like basis.
The board’s immediate follow-up: why had the headline figure presented a 15% growth rate without any indication of how much was organic? The answer was that Natalie’s pack showed reported figures only — the standard comparative format that accounting standards require for statutory accounts. The board needed something the statutory format does not provide: a bridge between reported growth and organic growth that separates structural change from operational performance.
Stop building consolidations in spreadsheets.
BrizoConsol automates multi-entity consolidation — setup in minutes, reports the same day.
This is the prior-period comparative problem in multi-entity group reporting. It arises whenever the group’s structure changes during the year — an acquisition, a disposal, a new subsidiary incorporated, or a subsidiary deconsolidated — and the current year consolidated results are therefore not on the same basis as the prior year. The statutory accounts address this through disclosure notes. The board pack should address it on the face of the report, in a format that directors can interpret without reading footnotes.
Why the Standard Comparative Format Is Insufficient for Boards
Accounting standards (IFRS 10, IFRS 3, FRS 102) require that consolidated financial statements include a comparative period. The prior period figures are the as-reported consolidated numbers for that period — they are not restated to reflect the current structure. This is correct accounting: the prior year is presented as it was, and the current year reflects the current structure. Any differences in scope are disclosed in the notes.
For a board reading a management pack, this format has a significant limitation: the YOY change in the headline numbers mixes operational performance with structural change, and the two are not separated on the face of the report. A 15% revenue increase might reflect 15% organic growth, 0% organic growth and 15% from an acquisition, or anything in between. A board that cannot immediately distinguish between these is not in a position to assess whether management has delivered on its operational targets.
The like-for-like (or organic) analysis bridges the gap. It does not replace the statutory comparative — it supplements it with a restatement of the prior year on a consistent basis, so that the period-on-period change reflects only operational performance and FX movements rather than the mechanical impact of structural changes.
Scenario 1: Mid-Year Acquisition — Separating Organic Growth from Structural Growth
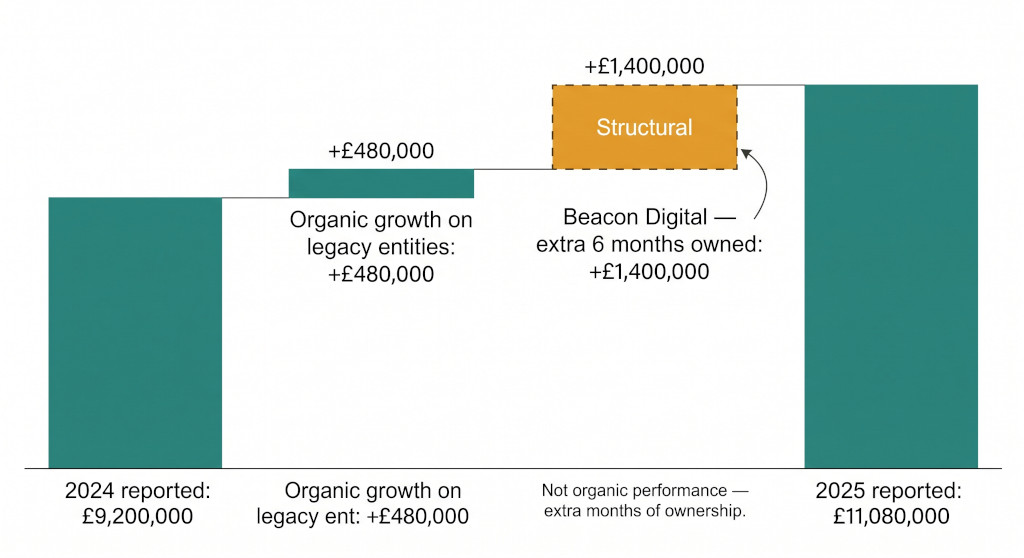
By the time Natalie prepares the 2025 full-year board pack, Beacon Digital has been owned for 18 months. The 2025 consolidated results include 12 full months of Beacon Digital. The 2024 comparatives include only 6 months (July to December 2024). The mechanical impact on the YOY comparison is that even if Beacon Digital’s performance is completely flat year-on-year, the consolidated revenue will appear to grow by approximately £1,300,000 — an extra 6 months of Beacon Digital’s contribution — with no underlying improvement in the group’s operational performance.
| Beacon Group — consolidated revenue | 2024 (£) | 2025 (£) | Change (£) | Change % |
|---|---|---|---|---|
| Legacy entities (same structure both years) | 8,000,000 | 8,480,000 | 480,000 | +6.0% |
| Beacon Digital (6 months in 2024; 12 months in 2025) | 1,200,000 | 2,600,000 | 1,400,000 | +116.7% |
| Total consolidated revenue (as reported) | 9,200,000 | 11,080,000 | 1,880,000 | +20.4% |
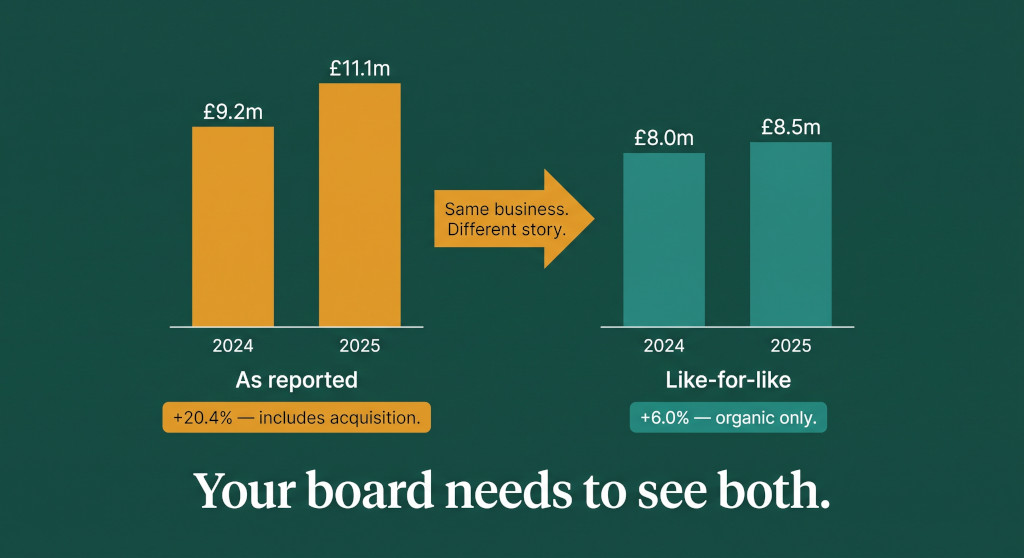
The as-reported YOY growth is 20.4%. But of the £1,880,000 increase, £1,400,000 is structural — the mechanical consequence of owning Beacon Digital for 12 months rather than 6. The organic growth of the legacy business is £480,000 on an £8,000,000 base: 6.0%. And of the £1,400,000 structural contribution from Beacon Digital, some portion reflects genuine performance improvement in the acquired business and some reflects simply owning it for longer. The as-reported figure conflates all three.
The like-for-like comparison for the board pack restates 2024 to include a full 12 months of Beacon Digital on a proforma basis, so that the 2024 and 2025 columns are on the same structural footing:
| Beacon Group — like-for-like revenue bridge | £ |
|---|---|
| 2024 revenue as reported | 9,200,000 |
| Add: Beacon Digital proforma H1 2024 (Jan–Jun, not owned) | 1,300,000 |
| 2024 revenue on a proforma 12-month basis | 10,500,000 |
| 2025 revenue as reported | 11,080,000 |
| Like-for-like growth (2025 vs proforma 2024) | +580,000 |
| Like-for-like growth % | +5.5% |
The like-for-like growth of 5.5% is the number that reflects genuine operational performance across the enlarged group — what the group would have grown by if it had owned Beacon Digital throughout both years. The 20.4% as-reported figure is not wrong; it is the correct statutory comparison. But the board needs both numbers on the face of the pack, with a clear label distinguishing them.
The revenue bridge is the most useful single addition to a post-acquisition board pack. It shows as-reported revenue, the proforma adjustment for the extra months of the acquired entity, the like-for-like baseline, and the like-for-like growth. It takes no more than a half-page of the board pack but converts a potentially misleading headline into a transparent and interpretable performance statement.
Building the Revenue Bridge for the Board
The revenue bridge separates the total YOY change into its constituent components. For Beacon Group’s 2025 pack, the bridge looks like this:
The bridge makes clear that of the £1,880,000 total increase, £1,300,000 is a structural effect (owning Beacon Digital for a full year instead of half a year), £480,000 is organic growth in the legacy businesses, and £100,000 is operational improvement within Beacon Digital itself. A board reading only the headline would attribute the full £1,880,000 to performance. The bridge tells the accurate story.
The proforma H1 2024 figure for Beacon Digital (£1,300,000) requires a judgement: it is not an audited number, it is an estimate of what Beacon Digital would have contributed in the six months before acquisition. The source can be: actual management accounts for that period (if available from due diligence); the acquisition’s own reported H1 2024 results; or a simple annualisation of H2 2024 actual results as a proxy. The source and basis should be labelled clearly in the board pack — “proforma, unaudited” — to distinguish it from the as-reported figures.
Scenario 2: Mid-Year Disposal — Restating the Prior Year
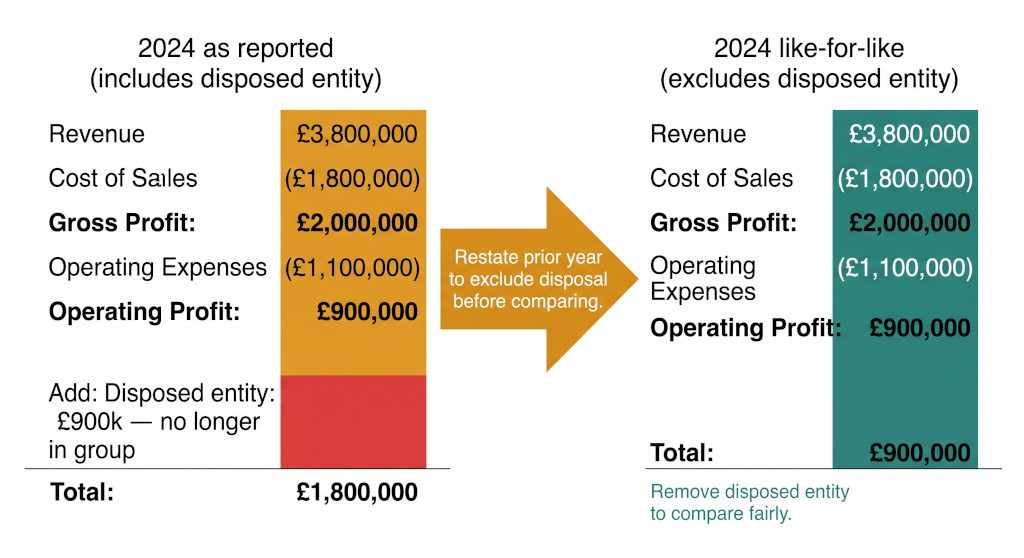
When a group disposes of a subsidiary during the year, the problem runs in the opposite direction. The current year consolidated P&L includes the disposed entity only up to the date of disposal; the prior year includes it for the full period (or from whenever it was acquired). YOY revenue appears to fall even if every remaining business has grown, simply because one entity is no longer in the group.
Suppose Beacon Group had disposed of a small events subsidiary — Beacon Events Ltd — on 30 September 2025, which had generated £900,000 of revenue in 2024 (full year) and £675,000 in 2025 (nine months to disposal). The as-reported comparison looks like this:
| Beacon Group — as reported including disposal effect | 2024 (£) | 2025 (£) | Change |
|---|---|---|---|
| Consolidated revenue (as reported) | 9,200,000 | 10,755,000 | +16.9% |
| Less: Beacon Events (disposed — 9 months 2025, 12 months 2024) | (900,000) | (675,000) | |
| Continuing operations only | 8,300,000 | 10,080,000 | +21.4% |
The restated comparison — continuing operations only — shows that the businesses the group is actually keeping and managing grew by 21.4%. The as-reported comparison, without adjustment, would mix the full-year disposal contribution in 2024 against the nine-month contribution in 2025, making the disposal appear to be a drag on reported performance even though the continuing businesses are the ones that matter to the board going forward.
The presentation convention for disposals in the board pack should distinguish clearly between “continuing operations” and “discontinued operations” — language that mirrors the IFRS 5 presentation required in statutory accounts, though the board pack does not need to follow the statutory format exactly. What it must do is show the board a comparable basis on which to assess performance: the businesses that will be in the group next year, measured against the same businesses last year.
The Full Like-for-Like P&L Table for the Board Pack
The most useful format in a board pack that has had both an acquisition and a disposal during the year is a five-column P&L: as reported 2024; proforma adjustment for mid-year acquisition (add H1 of acquired entity); disposal adjustment (remove disposed entity from 2024); proforma 2024 like-for-like; and 2025 as reported. This is more columns than the statutory accounts, but it is exactly the information a board needs to assess operational performance:
| Revenue | 2024 as reported | + Beacon Digital H1 | − Beacon Events | 2024 LFL | 2025 as reported | Growth |
|---|---|---|---|---|---|---|
| Legacy entities | 8,000,000 | — | (900,000) | 7,100,000 | 7,580,000 | +6.8% |
| Beacon Digital (acq. Jul 2024) | 1,200,000 | 1,300,000 | — | 2,500,000 | 2,600,000 | +4.0% |
| Beacon Events (disposed Sep 2025) | — | — | — | — | 675,000 | n/a |
| Total revenue | 9,200,000 | 1,300,000 | (900,000) | 9,600,000 | 10,855,000 | +6.3% LFL |
The like-for-like growth of 6.3% — across the businesses the group intends to continue owning — is the number that reflects management’s operational performance. The 18% headline growth from as-reported 2024 to as-reported 2025 includes structural noise that obscures it.
Adding the FX Bridge for Groups with Foreign Subsidiaries
For groups that have foreign subsidiaries, a further decomposition is useful: the portion of the YOY revenue change that reflects FX rate movements rather than genuine trading performance. If a EUR-reporting subsidiary generated the same volume of revenue in euros in both years, but EUR/GBP moved from 0.86 to 0.91 between the two periods, the GBP-translated revenue will appear to have grown even though the underlying business in euros was flat.
The FX bridge adds a further column to the revenue analysis: the constant-currency comparison, which translates both years at the same exchange rate (typically the prior year average rate) to show what growth would have been if FX had not moved. The difference between the constant-currency result and the as-reported result is the FX effect — mechanical, not operational.
For a group with one foreign subsidiary, this is a single calculation. For a group with multiple foreign entities in different currencies — a common situation for groups that have grown through international acquisition — the FX bridge becomes a material component of the board narrative, particularly in years when one or more functional currencies have moved significantly against the group’s presentation currency.
The bridge is as important as the table. Finance teams often produce the five-column like-for-like table but present it without a written narrative that explains what the board should take from it. A table showing a 6.3% LFL growth rate is only useful if the board understands what “LFL” means, what has been adjusted, and why the adjustment is appropriate. The narrative paragraph above the table — two or three sentences — is as important as the numbers it accompanies.
What to Label Clearly in the Board Pack
The most common failure in presenting post-acquisition or post-disposal comparatives is ambiguous labelling. Column headers that say “2024 adjusted” without specifying what has been adjusted, or footnotes that refer to “proforma figures” without explaining the basis, create confusion rather than clarity. A board member who is uncertain whether a figure is audited, estimated, or proforma will not rely on it — or will ask a question in the meeting that derails the agenda.
Clear labelling conventions for the board pack:
- “As reported” — the statutory comparative, unrestated, as it appears in the published accounts.
- “Proforma” — adjusted to include a full period of an acquired entity that was owned for only part of the prior year. Always label as “unaudited” and state the source of the proforma figures.
- “Like-for-like” or “LFL” — adjusted to reflect the same group structure in both periods. Specify in a footnote exactly what has been included and excluded.
- “Constant currency” — translated at prior year exchange rates. Specify the rates used.
- “Continuing operations” — excluding any entity that has been disposed of or classified as held for sale.
Boards that see consistent use of these labels across successive board packs develop the habit of reading them correctly. The first time a like-for-like analysis is introduced, a brief explanation in the commentary is necessary. After that, the label itself carries the meaning.
For a full treatment of what a group board pack should contain beyond the financial statements, see What Should a Group Board Pack Include? and Board Reporting for Multi-Entity Groups: How Group CFOs Build a Consolidated Board Pack That Directors Can Use. For the accounting mechanics when a new subsidiary is consolidated for the first time, see How to Consolidate a New Subsidiary Acquired During the Year.
Board packs that show the right comparison — automatically
BrizoConsol tracks group structure changes over time, so your board pack comparatives always reflect the same entities in both periods — with acquisition and disposal adjustments applied without manual rework.See It in Action