How to Decompose a Consolidated EBITDA Variance Into Entity Contribution, Mix, and Currency Effects
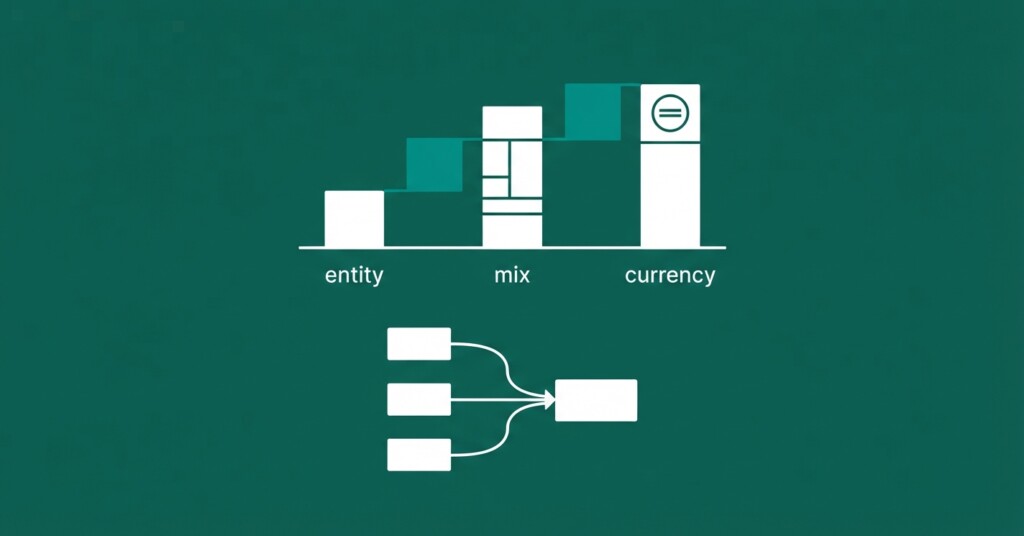
When a group misses its consolidated EBITDA target, the conversation in the boardroom moves fast. Which entity underperformed? Did currency headwinds distort an otherwise healthy operating result? Did a shift in revenue mix across subsidiaries flatter or penalise the margin? These are distinct questions, and conflating them leads to bad decisions. This article walks through a structured methodology for decomposing a consolidated EBITDA variance into three separate effects — entity contribution, mix, and currency — so finance teams can give precise answers rather than vague reassurances.
Why a Single Consolidated EBITDA Number Hides Too Much
Consolidated EBITDA is the sum of entity-level EBITDA figures after intercompany eliminations and FX translation into the group’s presentation currency. The moment you consolidate, individual entity signals blend together. A strong performance in one subsidiary can mask a deteriorating margin in another. A weakening of the reporting currency can make overseas earnings look larger in the group accounts, hiding a real operational problem underneath a favourable translation effect. Equally, a shift in revenue mix — where lower-margin entities grow faster than higher-margin ones — can drag group EBITDA margin even when every entity individually hits its targets. Untangling these effects is not optional for serious group financial management; it is the foundation of actionable variance analysis.
Step One — Establish the Baseline at Entity Level
Before you can decompose anything, you need clean entity-level EBITDA figures in both local currency and group presentation currency for the current period and the comparative period. This sounds straightforward but is often where the process breaks down. Intercompany revenues and costs must be eliminated before you calculate entity EBITDA, otherwise the numbers are inflated by intra-group trading. Any management recharges, shared service allocations, or interest on intercompany loans must be clearly flagged so you can decide whether to include or exclude them from the operating measure you are analysing.
Stop building consolidations in spreadsheets.
BrizoConsol automates multi-entity consolidation — setup in minutes, reports the same day.
Best practice is to maintain a consistent EBITDA definition at entity level and group level throughout the year. If you change what gets included — for example, treating certain restructuring charges as below-the-line mid-year — your variance analysis becomes incomparable. Document the definition and enforce it in your chart of accounts mapping.
Once you have clean entity-level figures, the consolidation pack should show for each entity: local currency EBITDA (current period), local currency EBITDA (prior period or budget), translated EBITDA at the actual FX rate used in the consolidation, and translated EBITDA at the prior period or budget FX rate. This four-column structure is the raw material for everything that follows.
Step Two — Isolate the Currency Translation Effect
The currency effect measures how much of the change in consolidated EBITDA is simply because exchange rates moved, not because the business performed differently. The calculation uses the prior-period or budget exchange rate as a constant to restate current-period local currency results. The difference between the actual translated result and the constant-rate restatement is the currency effect.
| Entity EBITDA in local currency (current period) | LC 4,200,000 |
| Translated at actual average rate (1.12) | EUR 3,750,000 |
| Translated at budget rate (1.20) | EUR 3,500,000 |
| Currency translation effect (favourable) | EUR 250,000 |
In this example, a USD-functional subsidiary earned USD 4.2 million of EBITDA. The dollar strengthened against the euro (the group presentation currency) relative to budget — the actual rate of 1.12 USD per EUR produced a higher euro equivalent than the budget rate of 1.20. The EUR 250,000 difference is a currency tailwind. It belongs in the currency column of your variance bridge, not in the operational performance column. Getting this wrong is common in Excel-based consolidations where the FX translation step is done manually and inconsistently.
Step Three — Calculate Entity Contribution Effect at Constant Currency
Once currency is stripped out, you can measure each entity’s true operational contribution to the variance. Entity contribution is simply the change in local currency EBITDA, translated at a constant rate. This tells you whether the entity genuinely earned more or less than the reference period, expressed in group currency terms without distortion from exchange rate movements.
| Entity | LC EBITDA Budget | LC EBITDA Actual | LC Variance | Constant Rate | Contribution (EUR) |
|---|---|---|---|---|---|
| UK OpCo | GBP 1,800,000 | GBP 1,950,000 | GBP +150,000 | 1.15 | EUR +130,435 |
| German SubCo | EUR 2,200,000 | EUR 1,900,000 | EUR -300,000 | 1.00 | EUR -300,000 |
| US Entity | USD 4,000,000 | USD 4,200,000 | USD +200,000 | 1.20 | EUR +166,667 |
| Singapore Branch | SGD 900,000 | SGD 780,000 | SGD -120,000 | 1.35 | EUR -88,889 |
| Group Total | — | — | — | — | EUR -91,787 |
The table reveals something that would be invisible in the single consolidated number: the US entity and UK OpCo both outperformed budget, but German SubCo and Singapore Branch underperformed significantly. The net operational miss is EUR 91,787 at constant currency — an underlying shortfall that can be masked at the consolidated group level when currency tailwinds add back value. Without this decomposition, management might focus cost-cutting energy on the wrong entities.
Step Four — Quantify the Revenue Mix Effect
The mix effect answers a subtler question: even if every entity hit its EBITDA margin target, did the distribution of revenue across entities cause the group margin to shift? This matters when entities have materially different EBITDA margin profiles. If a low-margin entity grows its revenue share faster than a high-margin entity, group EBITDA margin falls even though no entity has ‘underperformed’.
To isolate the mix effect, you apply the prior-period or budget EBITDA margin for each entity to the actual revenue split, then compare the result to what the group margin would have been at the budgeted revenue split. The difference is attributable to mix alone.
| Group EBITDA at actual revenue mix, budget margins | EUR 8,940,000 |
| Group EBITDA at budget revenue mix, budget margins | EUR 9,200,000 |
| Mix effect (adverse) | EUR -260,000 |
In this case, the Singapore branch and German SubCo grew revenue faster than expected, but both carry lower EBITDA margins than the UK and US entities. This diluted the group margin by EUR 260,000 — a structural mix effect that has nothing to do with any entity performing badly on a standalone basis. It is a group-level commercial question about where growth is happening.

Building the Full Variance Bridge
The three effects should sum to the total consolidated EBITDA variance. This reconciliation is your quality check. If the numbers do not bridge cleanly, you have a methodology error — often caused by applying different FX rates in different steps, or failing to eliminate intercompany margins before calculating entity EBITDA. The bridge should be explicit and auditable, not buried in tab seventeen of a consolidation workbook.
| Effect | Amount (EUR) | Direction |
|---|---|---|
| Entity contribution (constant currency) | EUR -91,787 | Adverse |
| Revenue mix effect | EUR -260,000 | Adverse |
| Currency translation effect | EUR +350,000 | Favourable |
| Total consolidated EBITDA variance | EUR -1,787 | Broadly flat |
The full picture here tells a coherent story. At the group level, EBITDA is essentially flat versus budget. But that flatness is the net result of a genuine operational shortfall (primarily German SubCo and Singapore branch), an adverse mix effect, and a helpful currency tailwind. Management cannot rely on that currency tailwind continuing; if FX rates reverse, the same operational problems will become much more visible. That is actionable intelligence. A single consolidated variance of EUR -1,787 communicates none of this.
Intercompany Eliminations and Their Impact on Entity EBITDA
A critical step that is often rushed is ensuring intercompany eliminations are applied consistently before entity-level EBITDA is calculated. If UK OpCo charges a management fee to Singapore branch, that fee is revenue for the UK and a cost for Singapore. Before you assess either entity’s contribution, you must eliminate the fee from both sides. Failure to do this means entity contribution effects are misstated — UK OpCo looks better than it really is, and Singapore branch looks worse.
| Account | Dr | Cr |
|---|---|---|
| Intercompany Management Fee Revenue — UK OpCo | 120,000 | |
| Intercompany Management Fee Expense — Singapore Branch | 120,000 |
Elimination of intra-group management fee charged by UK OpCo to Singapore branch. Both entities have been restated to remove this intercompany flow before entity EBITDA contribution is measured.
If management fees, royalties, or shared service recharges are eliminated at consolidation level but you perform your variance analysis on pre-elimination entity figures, your contribution analysis will be systematically wrong. Always confirm whether the entity EBITDA figures in your analysis pack are pre- or post-intercompany elimination before drawing conclusions.
Practical Challenges in Excel Versus Automated Consolidation
Finance teams that build this analysis in Excel face real obstacles. FX translation tables need to be maintained and version-controlled. Intercompany elimination entries must be matched and applied before entity figures are extracted. The constant-rate restatement step requires care to ensure you are using the correct rate for each entity in each period. When any of these steps are done manually across multiple workbooks, errors compound and reconciliation becomes a project of its own at month-end.
Automated consolidation platforms address this by holding the entity trial balances, FX rates, intercompany matching, and elimination entries in a single data model. When the variance analysis is run, every input — actual rate, budget rate, post-elimination EBITDA — is drawn from the same source. The bridge calculation becomes a report rather than a spreadsheet exercise. Finance teams in multi-entity SME groups that have moved to purpose-built consolidation tools consistently report that month-end variance reporting becomes faster and more reliable, because the underlying data integrity is enforced by the system rather than by manual discipline.
- Map every entity to a consistent EBITDA definition in your chart of accounts before the period opens.
- Capture both actual and budget FX rates at the start of each period and lock them in your consolidation system.
- Run intercompany matching and elimination before extracting entity EBITDA figures for variance analysis.
- Calculate entity contribution, mix, and currency effects in sequence, reconciling back to the total consolidated variance as a quality check.
- Automate the variance bridge output so it can be produced at any point in the close, not just at the end.
Using the Analysis in Group Management Reporting
The decomposition is only valuable if it reaches the right people in a usable format. CFOs and boards need the waterfall bridge at a high level — three or four bars showing entity contribution, mix, and currency. Finance managers and controllers need the entity-level detail to drive conversations with operational management. Accountants and consolidation teams need the underlying reconciliation to confirm the methodology is clean.
It is worth integrating this decomposition into your standard monthly group reporting pack rather than treating it as a one-off exercise when results disappoint. Doing it every month builds institutional familiarity with the methodology and surfaces trends — for example, a persistent mix drag that indicates a strategic pricing or portfolio question — that would not be visible from a single period’s analysis.
For accounting firms managing consolidation for SME clients with multiple entities, this level of analysis is increasingly expected. Clients with subsidiaries in different currency zones or with distinct margin profiles are asking the same questions their larger corporate counterparts have asked for years. The tools and methodology are now accessible at the SME scale, and firms that can deliver this analysis as part of their group reporting service are providing genuinely differentiated value.
A Note on Non-Controlling Interests
If any of the entities in the group are partially owned — that is, there is a non-controlling interest (NCI) — the contribution analysis needs an additional layer. The NCI share of an entity’s EBITDA variance should be shown separately, so the group’s attributable contribution is isolated from the minority’s share. This matters particularly when a partially owned subsidiary is either the strongest or weakest contributor to the variance: attributing 100% of its performance to the group overstates or understates the group’s actual exposure.
See Multi-Entity EBITDA Variance Analysis in Practice
BrizoConsol is built for SME finance teams managing multi-entity consolidation, intercompany eliminations, FX translation, and group reporting. See how the platform handles variance decomposition without the manual Excel overhead.
Stop building consolidations in spreadsheets.
BrizoConsol automates multi-entity consolidation — setup in minutes, reports the same day.