How to Find the Source of a Consolidation Difference
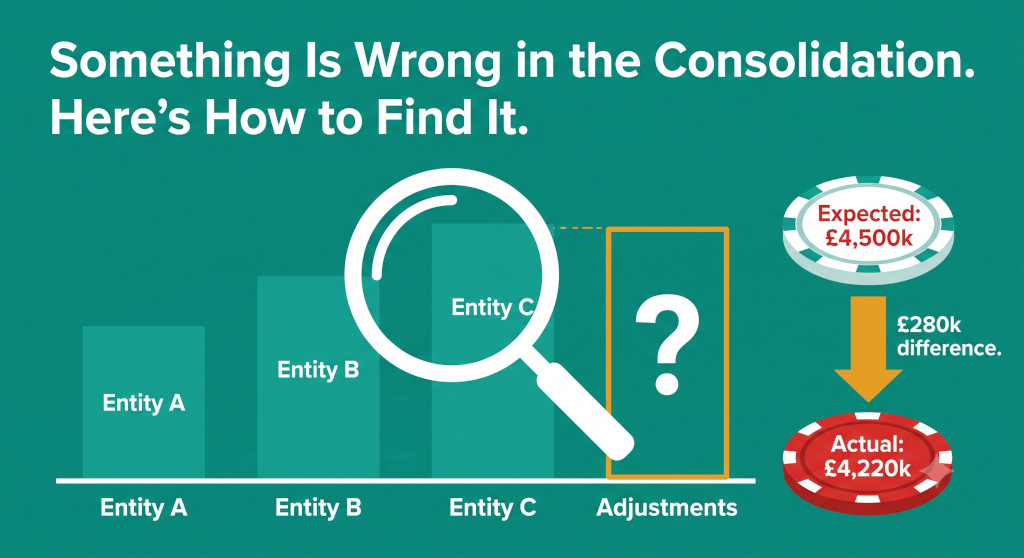
Lena had inherited the consolidation model when her predecessor left without a handover. She understood the structure of the model well enough to run the close, but she didn’t know every assumption baked into it. When the board pack was produced and the CFO challenged the group EBITDA figure — “this is £280k below what I’d expect from the entity management accounts; where’s the difference coming from?” — Lena needed a method, not a guess.
She could have started hunting through every cell in the model. She could have asked the auditors. She could have rebuilt the consolidation from scratch. Instead, she applied a systematic diagnostic approach that narrowed the £280k difference to a specific cause in under two hours — without rebuilding anything and without external help.
This post describes that approach. It is the meta-level diagnostic guide for any consolidation difference: the framework to apply when you know something is wrong but don’t yet know which specific type of error you have. The specific diagnostic posts for balance sheet imbalances, CTA reconciliation failures, and NCI mismatches are the next step once this framework has identified which type of difference you’re dealing with.
Stop building consolidations in spreadsheets.
BrizoConsol automates multi-entity consolidation — setup in minutes, reports the same day.
What Is a Consolidation Difference?
A consolidation difference is any figure in the consolidated financial statements that does not agree to an external reference. The external reference might be: the sum of entity-level management accounts; a prior-year figure that should have been stable; an auditor’s expectation built from the prior audit; a budget or forecast figure that reflected how the consolidation adjustments were expected to land; or a figure published in a prior document — a prospectus, a loan covenant certificate, a trading update — that should agree to the current accounts.
Consolidation differences are distinct from entity-level errors, but they are caused by similar things: something that was intended to be in the accounts is missing, something that was not intended is present, or something has been measured at the wrong amount. The additional complexity in a consolidated context is that there are more places for the error to hide — not just the entity trial balances, but also the intercompany eliminations, the consolidation adjustments, and the presentation layer — and the error in one layer can be masked by a compensating error in another.
The diagnostic framework below does not assume knowledge of what kind of error is present. It starts from the observed difference and narrows to the cause through four diagnostic dimensions.
The Four Diagnostic Dimensions
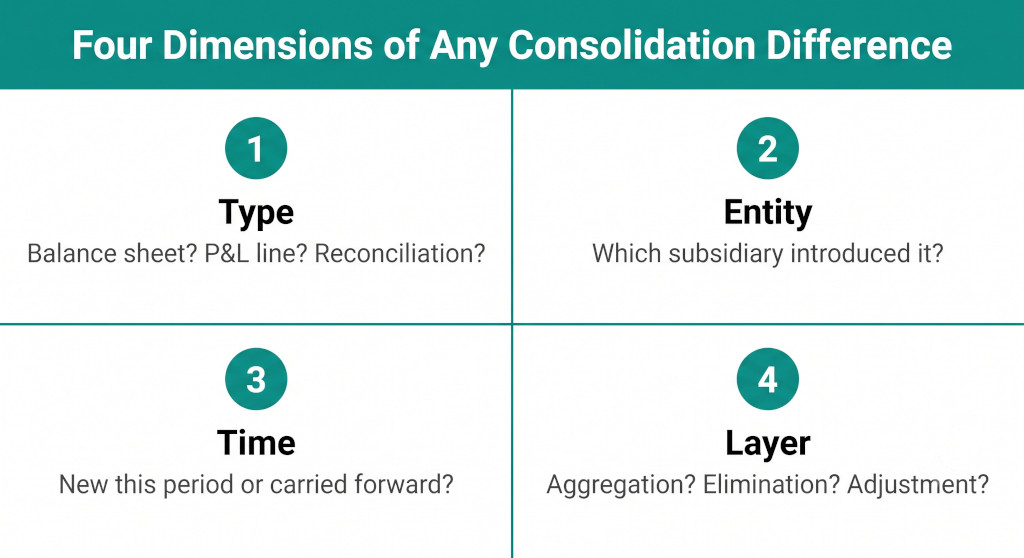
1 Type — What kind of difference is it?
Is the balance sheet out of balance (assets ≠ liabilities + equity)? Is a specific P&L or balance sheet line wrong relative to expectation? Does a reconciliation fail — the NCI roll-forward doesn’t close, the CTA doesn’t agree to the FCTR, the cash flow statement doesn’t reconcile to the balance sheet? Does a total figure disagree with an external reference (sum of entity management accounts, prior-year position, auditor expectation)? Identifying the type immediately routes the diagnosis to the appropriate specific framework: balance sheet imbalances to one checklist, reconciliation failures to another, general line-item differences to the four-layer investigation below.
2 Entity — Which subsidiary introduced it?
Most consolidation differences can be attributed to one entity or one intercompany relationship. The entity isolation technique — described in detail below — systematically identifies which entity contributes to the difference, narrowing the search from the entire consolidation model to a single entity’s workings.
3 Time — Is the difference new this period, or carried forward?
A difference that was also present in the prior period’s accounts — and was not corrected — is a carried-forward error. The current period’s new transactions cannot be the primary cause; the source is in the prior-period consolidation or in the opening balance entries. A difference that appears for the first time in the current period was introduced by something that changed this period: a new entity, a new elimination, a new adjustment, a changed formula. Time isolation prevents wasted effort investigating current-period workings when the error is in a prior-period assumption.
4 Layer — Which consolidation layer is the source?
Every consolidated set of accounts is built in layers. The layer isolation technique — also described below — identifies which layer of the consolidation model introduced the difference, further narrowing the search to the specific type of consolidation adjustment responsible.
The Entity Isolation Technique
Entity isolation is the fastest way to narrow a consolidation difference from “somewhere in the group” to “this specific entity.” The technique works by comparing what each entity contributes to the consolidation to what the external reference expects that entity to contribute — and identifying which entity produces the gap.
The practical method: build a comparison table with one row per entity. For each entity, show (a) the entity’s contribution to the consolidated figure as it appears in the consolidation model, and (b) the entity’s contribution as implied by the external reference (typically the entity’s management account figure, adjusted for any consolidation adjustments that should apply). The row where these two figures differ is the entity responsible for the difference.
| Entity | Mgmt Accounts EBITDA £’000 | Consolidation Contribution £’000 | Difference £’000 |
|---|---|---|---|
| UK Parent | 1,840 | 1,840 | — |
| Germany GmbH | 920 | 920 | — |
| Harrow Manufacturing Ltd | 1,140 | 860 | (280) |
| Crestfield Services Ltd | 600 | 600 | — |
| Group total | 4,500 | 4,220 | (280) |
The entity isolation table immediately identifies Harrow Manufacturing Ltd as the source entity. Every other entity’s consolidation contribution agrees to its management account EBITDA. Only Harrow Manufacturing is £280k lower in the consolidation than in the management accounts. The search is now bounded: the £280k difference originated in Harrow Manufacturing’s contribution to the consolidation, and the question becomes which consolidation adjustment applied to Harrow Manufacturing produced the £280k reduction.
Entity isolation works fastest when the external reference is the sum of management account figures. If the external reference is something else — a prior-year total, an auditor number, a forecast — the same technique applies but the “expected contribution” column is constructed differently: allocate the external reference total to each entity by the same methodology used to build the reference in the first place, then compare to the consolidation contributions.
The Layer Isolation Technique
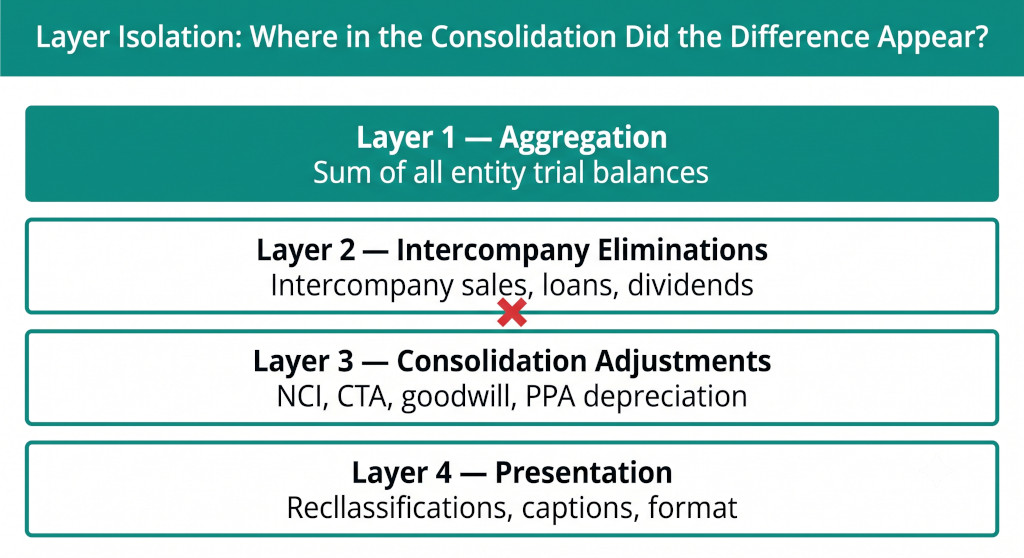
Once the source entity is identified, layer isolation identifies which consolidation adjustment is responsible. A consolidated set of accounts is built in four layers, each of which can be the source of a difference:
Layer 1 Aggregation — the sum of all entity trial balances, translated at the applicable exchange rates
Layer 2 Intercompany eliminations — intercompany sales and purchases, loans and interest, dividends, management fees, unrealised profit
Layer 3 Consolidation adjustments — NCI attribution, CTA, goodwill, PPA depreciation and amortisation, acquisition-date fair value entries
Layer 4 Presentation — reclassifications, caption changes, exceptional item disclosure, format adjustments
The layer isolation method tests each layer in turn. Start with Layer 1 — the aggregated trial balances before any adjustment. If the group EBITDA at Layer 1 agrees to the expected figure, the difference was introduced by a subsequent layer. If Layer 1 already shows the difference, it is in the trial balance aggregation itself (a missing entity, a wrong exchange rate, a sign error in an import formula).
If Layer 1 is correct, apply Layer 2 adjustments only and recheck. If the difference now appears, a Layer 2 intercompany elimination is the source. Apply Layer 3 and recheck again. A difference that appears at Layer 3 but not at Layer 2 is in a consolidation adjustment. And so on through Layer 4.
In practice, experienced practitioners can often skip straight to the most likely layer based on the nature of the difference. An EBITDA difference is unlikely to originate in Layer 3 (most consolidation adjustments — NCI attribution, CTA — do not affect EBITDA) and is very unlikely to originate in Layer 4 (presentation changes do not change totals). The most likely source of an EBITDA difference is Layer 2: an intercompany elimination that reduces one entity’s revenue or increases its costs without a compensating entry on the other side.
Worked Example: Tracing Lena’s £280,000 EBITDA Difference
Lena has used entity isolation to establish that the £280k difference is entirely attributable to Harrow Manufacturing Ltd. She now applies layer isolation to identify which consolidation adjustment is responsible.
Layer 1 check: Harrow Manufacturing’s trial balance contribution to group EBITDA at the aggregation layer — before any eliminations — is £1,140k, agreeing to the management account EBITDA. Layer 1 is clean. The difference was introduced by a consolidation adjustment, not by a trial balance import error.
Layer 2 check: Lena pulls every intercompany elimination that involves Harrow Manufacturing. There are two: an intercompany sale from Harrow Manufacturing to the UK Parent (Harrow supplies components to the parent’s assembly operation), and an intercompany loan between Harrow and the parent.
The intercompany loan eliminates Harrow’s interest receivable against the parent’s interest payable — this is a finance cost item, not an EBITDA item. It cannot be the source of an EBITDA difference.
The intercompany sale is the candidate. Harrow Manufacturing sold £880k of components to the UK Parent during the year. The intercompany sale elimination removes £880k from Harrow’s revenue and eliminates the corresponding £880k from the UK Parent’s cost of sales. Net effect on group revenue: −£880k. Net effect on group cost of sales: −£880k. Net effect on group EBITDA: zero — as expected for a straightforward intercompany sale where the buying entity has already sold the goods externally.
But Lena notices a second elimination entry: an unrealised profit elimination on intercompany inventory. The UK Parent has not yet sold all of the components purchased from Harrow. At period end, £560k of the components (at the transfer price) remain in the parent’s inventory. Harrow’s cost to produce those components was £280k, meaning the unrealised profit in the parent’s closing inventory is £280k.
The unrealised profit elimination reduces the consolidated cost of sales (and therefore increases EBITDA) by — wait: the elimination removes the unrealised profit from the group accounts by reducing inventory and increasing cost of sales. Let us be precise:
Unrealised profit in closing inventory elimination:
Dr Cost of sales £280,000
Cr Inventory (UK Parent) £280,000
Effect: Inventory reduced to cost (£280k).
Cost of sales increased by £280k.
EBITDA impact: Cost of sales ↑ £280k → EBITDA ↓ £280k.
This is a Layer 2 adjustment — it appears in the intercompany elimination layer.
This is the source of Lena’s £280k gap. The management account EBITDA for Harrow Manufacturing includes Harrow’s £280k gross profit on the intercompany sale of components that are still sitting in the parent’s inventory at period end. The consolidated accounts correctly eliminate that unrealised profit — since the group has not yet realised it through an external sale — by increasing the consolidated cost of sales by £280k. The result is that consolidated EBITDA is £280k lower than the sum of entity management accounts, correctly.
This is not a consolidation error. It is a correct consolidation adjustment that produces an intentional and explainable difference between the consolidated EBITDA and the sum of entity management accounts. The diagnostic has served its purpose: not to find a mistake, but to understand why the numbers differ so that the CFO can be given a clear explanation.
Not every consolidation difference is an error. Intercompany eliminations, CTA entries, NCI attribution, PPA depreciation, and fair value adjustments all create intentional differences between the sum of entity management accounts and the consolidated figures. The diagnostic process identifies the source of the difference; whether the source represents an error or a correct consolidation treatment is a separate judgment. In Lena’s case, the difference is correct and expected — but it had never been explained to the CFO, because no one had traced it before.
Common Patterns: Differences With Recognisable Signatures
Certain types of consolidation differences have characteristic patterns that allow experienced practitioners to shortcut the diagnostic. Recognising these patterns can compress a two-hour investigation into a twenty-minute one.
Difference = sum of all intercompany management fees
When the consolidated revenue is lower than the sum of entity revenues by an amount that equals total intercompany management fees charged, the management fee eliminations are working correctly but the CFO or external reviewer is comparing consolidated revenue to entity-level revenue without accounting for the elimination. The difference is expected and correct; the explanation is the management fee elimination.
Difference changes by the same amount each period
A difference that grows or shrinks by the same fixed amount each period is almost certainly a recurring consolidation adjustment that was present in one reference but not the other: PPA intangible amortisation, goodwill impairment charge, or recurring fair value depreciation. These items appear in the consolidated accounts but not in entity management accounts, so the consolidated P&L will be consistently lower than the entity aggregate by the annual amortisation charge.
Difference = exactly twice a known balance
As with balance sheet imbalances, a difference that equals exactly twice a known intercompany balance suggests a double elimination — the same intercompany flow has been eliminated twice, removing it from the consolidated accounts in full when it should only have been eliminated once. Check the elimination schedule for duplicated journal entries.
Difference appears only in multi-currency periods
A difference that appears specifically in periods where foreign subsidiaries have significant currency movements is almost certainly a translation effect: either the management accounts were converted at a different rate (for example, the budget rate) than the consolidation translation (average rate), or an exchange difference was posted to an unexpected line in the P&L. Check the exchange rates used in the management accounts against the consolidation exchange rates.
Difference is consistent across all periods since a specific acquisition
A difference that appeared for the first time in the period a subsidiary was acquired and has been consistent since then is likely an acquisition accounting item: PPA depreciation or amortisation that the entity management accounts don’t show, or a fair value adjustment to inventory that was expensed in the period but appears only in the consolidated accounts. Review the acquisition journal and PPA schedule for the entity acquired in that period.
When to Involve the Auditors
Most consolidation differences can be resolved internally using the diagnostic framework above. Auditor involvement becomes appropriate when: the difference is material and cannot be traced to a specific cause after a systematic investigation; the difference appears to involve a prior-period misstatement that may require restatement; the difference suggests a control failure — such as an entity that should have been consolidated and wasn’t — that has governance implications beyond the current period; or the difference involves a judgment area (goodwill impairment, fair value measurement, consolidation scope) where the group and the auditors need to agree on the treatment before the accounts are finalised.
Involving auditors early, with a clear description of the nature and amount of the difference and the diagnostic steps already completed, is more efficient than involving them after an inconclusive internal investigation. Auditors are not diagnosticians for hire — they are more useful as a sounding board on complex judgment questions once the factual source of the difference has been established.
Full audit trail — from entity trial balance to group P&L
BrizoConsol shows the consolidation contribution of every entity at every layer — aggregation, elimination, adjustment — so you can trace any consolidation difference to its source in seconds, not hours.See It In Action
Consolidation Difference Diagnostic Checklist
- Define the difference precisely. What is the consolidated figure? What is the external reference? What is the exact amount and direction of the gap? A loosely defined difference produces a loose investigation.
- Classify the type of difference. Balance sheet imbalance → see Why Doesn’t My Consolidated Balance Sheet Balance?. CTA reconciliation failure → see Why Does My CTA Not Reconcile?. NCI mismatch → see Why Does My NCI Calculation Not Match?. General line-item difference → continue with the framework below.
- Establish whether the difference is new or carried forward. Compare the current period difference to the prior period. If the same gap existed before, the error is in a prior-period opening balance or a carried-forward assumption; do not waste time investigating current-period entries.
- Build the entity isolation table. For each entity, compare its contribution to the consolidated figure with its contribution implied by the external reference. The entity where these diverge is the source entity.
- Apply layer isolation to the source entity. Check the contribution at Layer 1 (aggregation) before any adjustment. If correct, add Layer 2 (intercompany eliminations) and recheck. If the difference appears at Layer 2, it is in an intercompany elimination. If Layer 2 is still correct, add Layer 3 (consolidation adjustments) and recheck.
- Within the identified layer, check the amount. The difference amount should match a specific elimination or adjustment entry within the identified layer. Identify that entry and confirm whether it represents an error or a correct consolidation treatment.
- Check for compensating errors. A difference in one layer may be partially masked by a compensating difference in another. If the entity isolation shows a smaller-than-expected difference in the source entity, check whether another entity has a compensating difference in the opposite direction — the gross differences may be larger than the net.
- Confirm whether the difference is an error or a correct adjustment. Intercompany eliminations, CTA, NCI, and PPA entries create intentional differences between entity management accounts and consolidated figures. Before concluding that a difference is an error, confirm it is not a correct consolidation adjustment that was simply not anticipated or explained in the management commentary.
- If the difference is an error, correct it and verify the correction. Post the correcting entry, rerun the consolidation, and confirm the difference closes to zero. Check for any downstream effects — a correcting entry in one line may affect other lines, the balance sheet, or the cash flow statement.
- Document the source and resolution. Record the identified source, the correction posted, and the confirmation that the difference is resolved. If the difference is a correct adjustment rather than an error, document the explanation so it is available for the CFO commentary and for auditor queries. Both outcomes should be in the close file.
Finding the source of a consolidation difference is a skill that compounds with experience but degrades without a framework. The practitioners who are fastest at it are not the ones with the longest memory — they are the ones who apply a systematic method rather than an intuitive scan. The entity isolation and layer isolation techniques above produce a bounded search space from any starting point, and the result is a source identification that is documented, repeatable, and explainable to the CFO and the auditors alike.
Stop hunting. Start closing.
BrizoConsol’s transparent consolidation model shows exactly what each adjustment does to each entity’s contribution — so consolidation differences are explained, not mysterious. Start free today. Start Free Trial