How to Manage Consolidation When Every Subsidiary Has a Different Excel Template
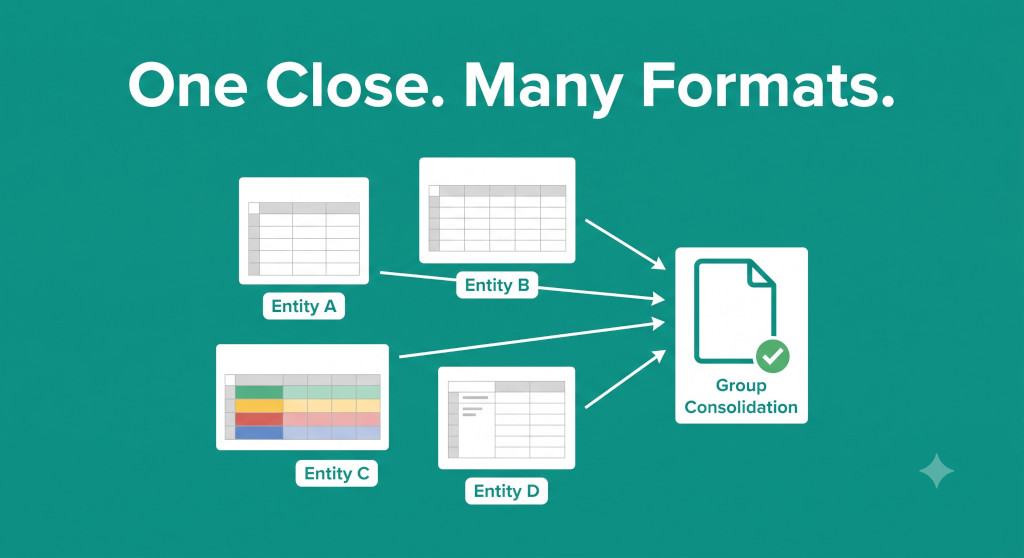
It is the third working day of the month. James has seven trial balance files in his inbox. One is a standard Xero export with account codes in column A and closing balances in column G. One is a custom QuickBooks report with subtotals embedded between data rows. Two are manually maintained Excel workbooks — one with accounts listed top-to-bottom as they were added over ten years, the other formatted as a pivot table somebody built in 2019 and never changed. One is from the German subsidiary and the column headers are in German. One has a tab called “FINAL v3 USE THIS ONE” and another tab called “FINAL v4 ACTUALLY USE THIS”. The last one was sent by the Singapore entity’s external bookkeeper as a PDF, followed twenty minutes later by a corrected Excel.
James has forty-eight hours until the group pack needs to go to the board. He spends the first twelve of them reformatting files.
This is not an unusual situation. For any group that grew through acquisition or that has subsidiaries using different accounting software, format inconsistency is the normal state of affairs. The question is not how to eliminate it — that would require a level of standardisation that is rarely achievable across a multi-entity group — but how to manage it systematically so that it doesn’t consume the close every single month.
Replace your Excel consolidation — for good.
BrizoConsol automates what you've been doing in Excel, faster and without the errors.
Why Subsidiary Templates Diverge in the First Place
Template inconsistency is almost never deliberate. It accumulates through three independent mechanisms, each of which makes complete sense locally but creates problems at the group level.
The first mechanism is organic growth. A subsidiary that has been operating for ten years built its chart of accounts incrementally, adding codes as new revenue streams and cost categories emerged. The result is an account structure that reflects the entity’s operational history rather than any group-wide logic. The codes may not be numbered sequentially. Categories that the group treats as one line item may be split across four accounts in the subsidiary, or collapsed into one.
The second mechanism is software variation. A subsidiary reporting out of Xero exports a trial balance in one format; one on QuickBooks exports in another; one maintained in a local accounting package exports in a format that requires manual clean-up before it resembles a trial balance at all. Even two subsidiaries on the same software may export different layouts if they were set up by different implementers or at different times.
The third mechanism is acquisition. When the group acquires a business, that business arrives with its existing accounting infrastructure intact. Migrating it to a group-standard chart of accounts takes time — often more than a year — and in the meantime the acquired entity submits data in whatever format its system produces. The group consolidation has to absorb that format for as long as the integration takes.
The root cause in every case is the same: subsidiaries optimise their accounting for their own operational needs, not for group reporting. The group consolidation process has to bridge that gap — and the wider the gap, the more time it takes at close.
The Three Categories of Template Difference
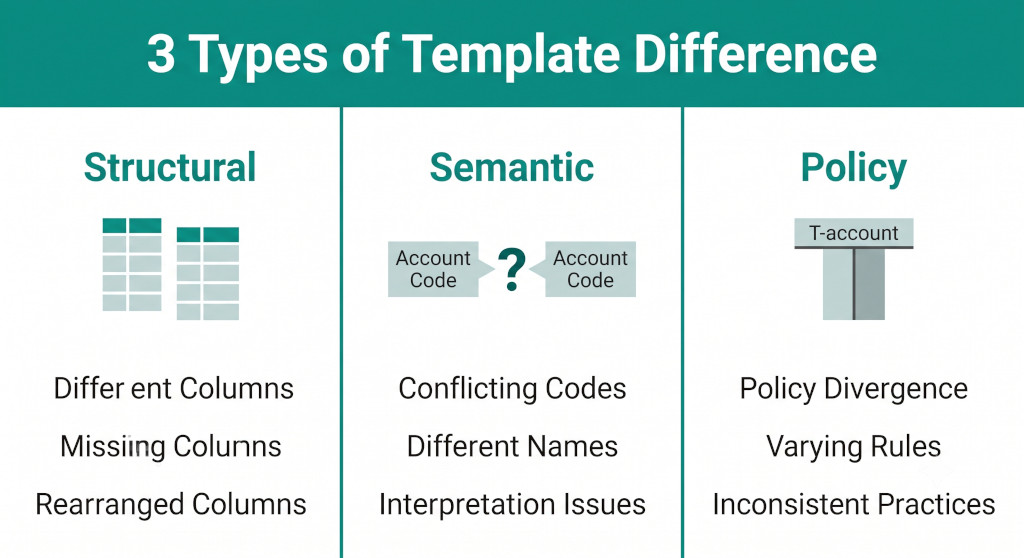
Before designing a solution, it helps to categorise the problem precisely. Template differences fall into three types, each of which requires a different fix.
Structural differences
These are layout problems: the data is correct but it’s in the wrong place. Columns are in a different order. Balances are expressed as debits and credits in separate columns rather than as signed integers. Subtotals are embedded in the data range. Header rows appear on row 3 instead of row 1. A “Total Revenue” row sits between the revenue lines and the cost lines, and needs to be removed before the data can be summed correctly.
Structural differences are the most mechanical to fix and the most time-consuming to fix manually. They can usually be automated with a consistent ETL (extract, transform, load) step — either a set of Excel formulas applied to a raw import tab, or a simple script that normalises the layout before it reaches the consolidation workbook. The challenge is that each subsidiary’s structural quirks are slightly different, so the fix needs to be tailored per entity and then maintained as the entity’s reporting format evolves.
Semantic differences
These are meaning problems: the structure is fine but the account codes or account names don’t correspond to the group’s chart of accounts. “Revenue — Professional Fees” in one entity maps to “Consulting Income” in another and “Service Revenue” in a third. Account code 4100 means trade debtors in one entity and revenue in another. The balance for each line is correct; the question is which group account it belongs to.
Semantic differences cannot be fixed by reformatting. They require a mapping table: a maintained register that matches each entity’s account codes and names to the corresponding group account. This is the single most important structural component of a well-run consolidation data collection process, and it’s the one most likely to be missing or out of date.
Policy differences
These are classification problems: the entity has recognised or classified a transaction in a way that differs from group policy. An entity that expenses all software development costs as incurred will report them in operating expenses; a group that capitalises qualifying development costs needs to reclassify them. An entity reporting under a different accounting standard may present finance lease liabilities in a different position on the balance sheet than the group standard requires.
Policy differences require consolidation adjusting journals, not formatting fixes. They need to be identified before the close, documented, and applied consistently each period. This is a separate problem from the template format issue, but it arrives in the same batch of files and needs to be handled as part of the same data normalisation process.
Building a Data Collection Framework That Absorbs Format Variation
The solution to format inconsistency is not to force every subsidiary onto a single template — in most groups that’s neither practical nor politically achievable. The solution is to build a data collection layer that sits between the subsidiary’s native format and the group consolidation workbook, and that handles the translation reliably and repeatably.
A well-designed data collection framework has four components.
1. A standardised submission template (where feasible)
For subsidiaries whose accounting software cannot export directly to a group-standard format, a standardised submission template is the lowest-effort solution for both sides. The template asks subsidiaries to paste their trial balance into a specific range, with account codes in column A, account names in column B, and a single signed closing balance in column C. All other columns are locked. The template validates that the balance sheet balances before it can be submitted.
The practical limitation is adoption. Finance teams at subsidiaries that have been running their own reporting processes for years often resist being told to use a new template. The template also needs to be updated whenever the group chart of accounts changes, and someone has to own that update process. Despite these limitations, it is worth implementing for any subsidiary whose native export format requires more than fifteen minutes of manual clean-up each month.
2. A per-entity import normalisation step
For subsidiaries where the submission template isn’t feasible — typically acquired entities still on their own systems, or large subsidiaries with strong finance teams who won’t change their reporting format — the normalisation step needs to happen on the group side. This means building a dedicated import tab for each entity in the consolidation workbook (or a standalone normalisation file that feeds into it), with formulas that extract and restructure the entity’s native export into the group standard layout.
This is more work upfront but has a significant long-term benefit: once built correctly, the per-entity import tab runs automatically each month. The group consolidator pastes in the raw export, the normalisation formulas run, and the structured trial balance appears in the output range. The fifteen-minute manual reformat becomes a thirty-second paste. The risk is that the normalisation tab breaks silently if the entity’s export format changes — a new version of their software, a new bookkeeper who exports a different report — so each entity’s import tab needs a validation check that confirms the output is structurally sound before it feeds the consolidation.
3. The master mapping table
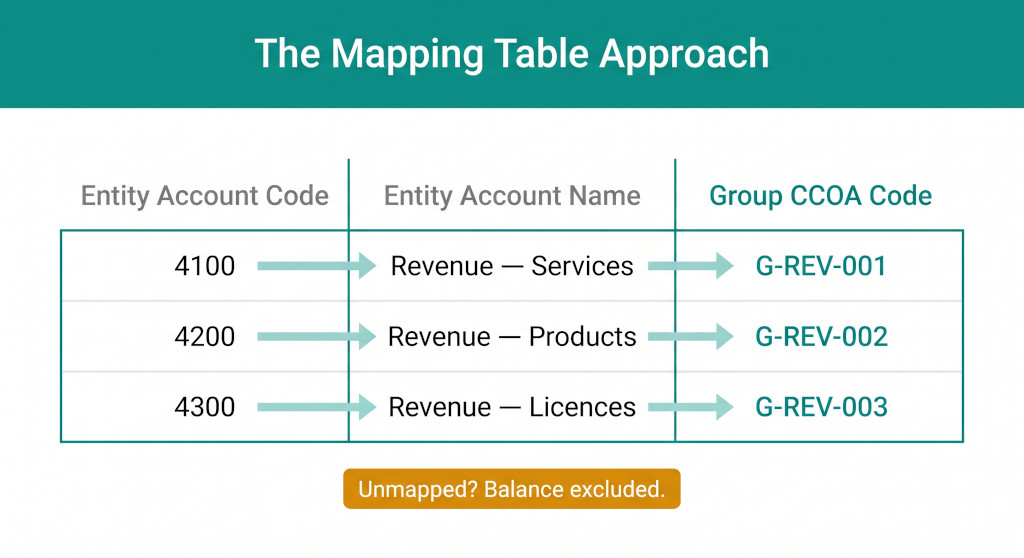
The mapping table is the heart of the data collection framework. It is a maintained register with one row per entity account code, linking it to the corresponding group common chart of accounts (CCOA) code. For a group with six entities averaging 200 account codes each, the mapping table has approximately 1,200 rows — but it only needs to be built once per entity, and then maintained incrementally as account codes are added or changed.
A well-structured mapping table has at minimum these columns:
| Column | Contents | Notes |
|---|---|---|
| Entity ID | Short code identifying the subsidiary | Used to filter the table for each entity’s import step |
| Entity Account Code | The account code as it appears in the entity’s trial balance export | Must match exactly — including leading zeros if present |
| Entity Account Name | The account name as it appears in the export | Useful for validation; confirms the code has mapped to the right line |
| Group CCOA Code | The corresponding group account code | This is the lookup target for the consolidation formulas |
| Group CCOA Name | The group account name | Human-readable confirmation of the mapping |
| Financial Statement | P&L or Balance Sheet | Used to route the balance to the correct statement in the consolidation |
| Last Verified | Date the mapping was last confirmed as correct | Any row not verified in the last 12 months should be reviewed |
The most important discipline is handling unmapped accounts. If an entity account code appears in a trial balance export but has no corresponding row in the mapping table, the balance for that account must not be silently excluded from the consolidation — it must trigger a visible error. A formula that returns zero for an unmapped code without flagging it is the most dangerous element in any manually-maintained consolidation workbook. You can read a detailed guide to designing a common chart of accounts for multi-entity groups, which covers the structural decisions that make mapping tables easier to maintain.
Common mistake: Using VLOOKUP or INDEX/MATCH with no error-handling for unmatched codes. If a subsidiary adds a new account code mid-year and the mapping table isn’t updated, the VLOOKUP returns zero, the balance disappears from the consolidation, and the trial balance check at entity level still passes. The only way to catch this is an explicit reconciliation between the sum of all mapped balances and the entity’s total trial balance — that reconciliation must be built into the import process and flagged visibly if it fails.
4. A submission management log
The fourth component is the simplest and most often missing: a submission log that tracks, for each entity and each period, when the trial balance was received, which version is being used in the consolidation, and who approved it as final. This solves the “FINAL v4 ACTUALLY USE THIS ONE” problem structurally rather than relying on whoever opens the email to make the right judgement call at 9pm on close day.
The submission log doesn’t need to be sophisticated. A shared spreadsheet with one row per entity per period, columns for Submitted Date, File Name, Approved By, and Used in Consolidation (yes/no), is sufficient. The critical discipline is that the consolidation workbook only pulls from files that have been marked as approved in the submission log — never from the most recently received file without that check.
Skip the reformatting entirely
BrizoConsol connects directly to Xero, QuickBooks, MYOB, and Zoho Books and pulls each entity’s trial balance automatically — with account mapping built in. No paste, no reformat, no submission log required.See It In Action
A Worked Example: Normalising Three Different Formats
To make this concrete, consider a group with three subsidiaries submitting in three different formats. The group needs to map all three to a single P&L revenue line: Group Account G-REV-001, “Total Revenue.”
| Entity | Entity Account Code | Entity Account Name | Raw Balance | Mapped To | Issue |
|---|---|---|---|---|---|
| UK OpCo | 4000 | Sales Revenue | £842,000 | G-REV-001 | None — clean mapping |
| UK OpCo | 4010 | Sales Returns | £(14,000) | G-REV-001 | Contra account — balance must net into revenue, not appear separately |
| Germany GmbH | 8000 | Umsatzerlöse | €620,000 | G-REV-001 | Requires EUR→GBP translation before mapping |
| Germany GmbH | 8010 | Erlösschmälerungen | €(9,500) | G-REV-001 | German revenue contra — same netting requirement as UK OpCo’s 4010 |
| Singapore Pte | REV-SVC | Service Revenue | S$310,000 | G-REV-001 | Requires SGD→GBP translation; code format different from other entities |
| Singapore Pte | REV-LIC | Licence Revenue | S$88,000 | G-REV-001 | Second revenue code that must consolidate into the same group line |
The consolidated group revenue line G-REV-001 is therefore:
UK OpCo: £842,000 – £14,000 = £828,000 Germany GmbH: (€620,000 – €9,500) × 0.856 = £522,572 Singapore Pte: (S$310,000 + S$88,000) × 0.573 = £228,054 ────────────────────────────────────────────────────── Group Revenue (G-REV-001) = £1,578,626
Each of the six source lines in this example requires a different handling rule in the mapping table: contra netting, currency translation at the correct average rate, and multiple-to-one code consolidation. None of those rules can be expressed as a simple VLOOKUP. They need to be built into the per-entity normalisation step so that the mapping table can stay clean and the consolidation formulas remain simple.
This is exactly the kind of complexity that makes a manually-maintained Excel consolidation fragile over time. As the number of entities grows and the per-entity rules multiply, the normalisation logic becomes increasingly difficult to audit. A new team member inheriting the workbook has to understand not just what the mapping table says, but also the hidden normalisation rules embedded in each entity’s import tab. This is one of the core reasons that growing groups eventually move to purpose-built software — not because Excel can’t express the logic, but because the logic becomes too distributed across the workbook to be confidently maintained by anyone other than its original author. For a broader view of these failure modes, see Why Excel Consolidation Breaks When Your Group Gets More Complex.
What to Do When a Subsidiary Misses the Deadline
Every consolidation framework eventually runs into the situation where one or more subsidiaries haven’t submitted their trial balance by the time the close needs to start. The wrong response is to wait and compress the rest of the process. The right response is to have a defined protocol for this situation that was agreed in advance.
The protocol should specify: what prior-period data is used as a placeholder (typically last month’s actuals, clearly flagged in the consolidation as provisional), who at the subsidiary is accountable for the late submission, and at what point a late submission triggers an escalation. The protocol also needs to address the intercompany reconciliation consequences of a missing entity — if Entity C hasn’t submitted and Entity A has an intercompany receivable from Entity C, the elimination can’t be performed. See Why Your Intercompany Balances Never Match Even When Both Companies Agree for a detailed look at how intercompany timing differences create reconciliation problems that format issues alone don’t explain.
The submission management log described above is essential for enforcing this protocol: it makes it immediately visible which entities have submitted, which haven’t, and which versions have been approved — without anyone having to check their email.
Practical Checklist: Building a Durable Data Collection Process
- Audit each entity’s native export format. For every subsidiary, document exactly what their trial balance export looks like — which columns, which rows, whether subtotals are embedded, how account codes are formatted. This is the baseline for building each entity’s normalisation step.
- Classify each entity’s template differences. For each entity, identify which differences are structural (layout), which are semantic (account mapping), and which are policy (accounting treatment). Each category requires a different fix.
- Build or update the master mapping table. Ensure every entity account code has a corresponding group CCOA code. Add an explicit unmapped-account error check to every import tab.
- Add a reconciliation check to every entity’s import tab. The sum of all mapped balances in the normalised output must equal the entity’s total trial balance. If it doesn’t, the tab should display a visible error before the data reaches the consolidation.
- Standardise your submission deadline and communicate it as a hard date. Not “as soon as possible after month-end” — a specific date and time, with a named contact responsible for chasing. See the Multi-Entity Month-End Close Checklist for a full close process framework including submission timelines.
- Implement a submission management log. Track received date, file name, version, approved by, and used-in-consolidation status for every entity every period. Never pull from an unapproved file.
- Define a late submission protocol. Agree in advance what placeholder data is used when a subsidiary misses the deadline and at what point the CFO is notified.
- Review the mapping table at the start of each quarter. Ask every subsidiary to confirm their chart of accounts hasn’t changed. Any new account codes need to be mapped before the next close, not during it.
- Document the normalisation logic for each entity’s import tab. The documentation should be sufficient for a replacement team member to understand and maintain the tab without asking anyone for help. Month-End Group Consolidation in Under 30 Minutes provides a broader framework for structuring the close process around these principles.
- Time the reformatting work. For each entity, measure how long the data normalisation step takes each month. Any entity taking more than twenty minutes per close is a candidate for a structural fix — either a standardised submission template, a more robust normalisation tab, or a direct software integration that bypasses the manual export entirely.
James’s twelve-hour reformat problem is solvable. It requires an upfront investment — probably two or three days to build out the import tabs, mapping table, and submission log properly — but once in place the process runs in minutes rather than hours. The key discipline is to build the normalisation layer once, correctly, and maintain it proactively rather than reactively: updating the mapping table when an account code changes, not when the missing balance turns up as an unexplained variance at close. The close itself should be the easy part.
Automate the data collection, not just the consolidation
BrizoConsol pulls trial balances directly from Xero, QuickBooks, MYOB, and Zoho Books — with AI-assisted account mapping that learns your group’s chart of accounts. Start free and run your first consolidated report in hours. Start Free Trial