Why Excel Consolidation Breaks When Your Group Gets More Complex
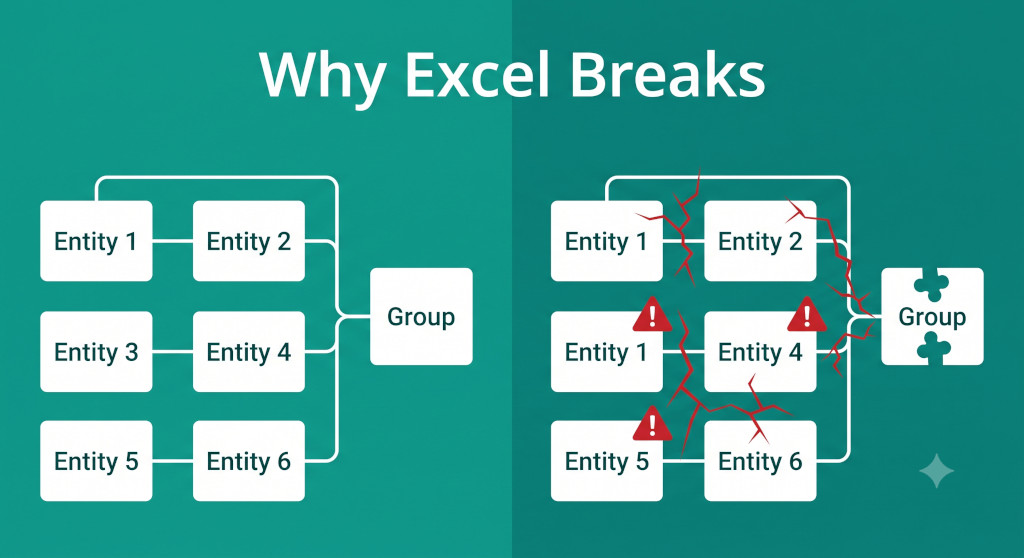
Rachel had been running the group consolidation for three years without a serious incident. The workbook was hers: 47 tabs, colour-coded by entity, a master elimination sheet she’d built herself, and a roll-forward that updated automatically when she pasted in each subsidiary’s trial balance. For a four-entity group — all UK-based, all reporting in sterling, all on the same accounting standard — it held together.
Then the group acquired two overseas subsidiaries in the same quarter. Entity 5 reported in euros. Entity 6 was incorporated in Singapore and reported under SFRS. One of them had a minority shareholder. And suddenly Rachel’s workbook, which had never once been wrong, was producing a consolidated balance sheet that didn’t balance. Her elimination cross-checks were failing. The cumulative translation adjustment was appearing in the wrong place. She spent eleven days on that close. The board pack went out two weeks late.
This is not a story about a bad spreadsheet. Rachel’s workbook was genuinely well-built. It’s a story about the structural limits of Excel as a consolidation tool — limits that stay invisible until the group crosses certain complexity thresholds, and then become very visible, very quickly. This post maps those thresholds precisely: what breaks, why it breaks, and at what point each failure mode tends to trigger.
Replace your Excel consolidation — for good.
BrizoConsol automates what you've been doing in Excel, faster and without the errors.
What Made the Excel Consolidation Work in the First Place
It’s worth being clear about what Excel actually does well in a simple consolidation, because the failure modes only make sense against that backdrop. When you have two or three entities, all in the same currency, all following the same accounting standard, and with no non-controlling interests, consolidation is essentially a sum-and-eliminate exercise. You add the trial balances together and remove the intercompany transactions. Excel handles that cleanly. The workbook is auditable, the logic is transparent, and a competent accountant can rebuild it from scratch if needed.
The problem is not Excel per se — it’s that the manual, cell-reference-based architecture of a typical consolidation workbook has a complexity ceiling. As the group grows, the number of variables the workbook has to track increases non-linearly. Each new entity doesn’t add one layer of complexity; it multiplies the interactions between all existing entities. At a certain point, the workbook structure that worked at three entities simply cannot hold the load at six or eight.
The failure modes described below don’t all arrive at once. Each one has its own trigger. But they tend to compound: the moment you add a foreign currency entity, you’re usually also adding the first non-UK accounting standard and often the first partial ownership structure, because international acquisitions rarely arrive in isolation.
Failure Mode 1: Intercompany Eliminations Stop Being Pairwise
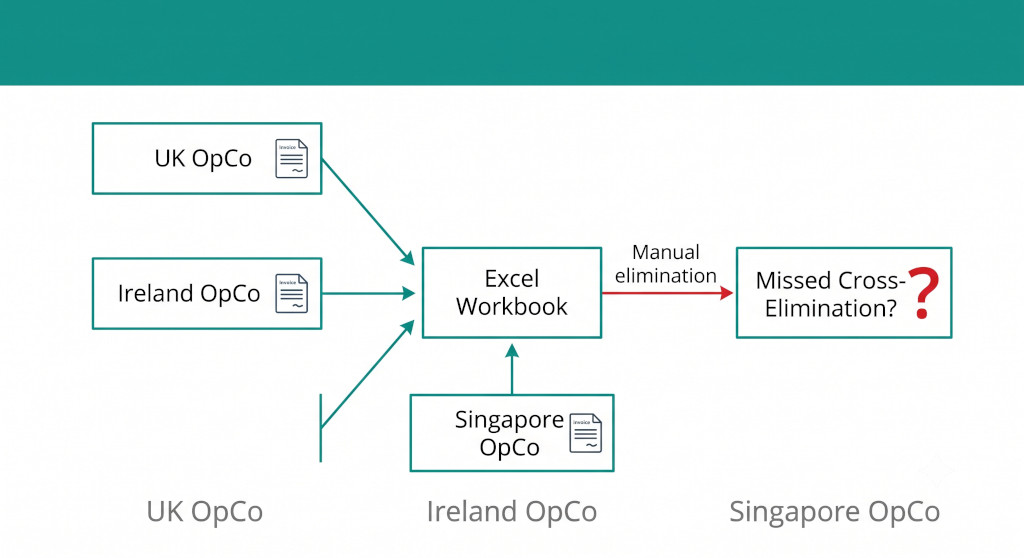
In a two-entity group, intercompany eliminations are simple: one entity has a receivable, the other has a payable, you eliminate both. In a three-entity group, you might have three intercompany pairs. In a six-entity group, you can have up to fifteen intercompany pairs — and the moment you introduce trading between more than two entities in a chain (A sells to B, B sells to C, and C still holds the inventory), you have a cascading profit elimination problem that Excel’s flat structure handles very badly.
Consider this scenario, which is extremely common in manufacturing and distribution groups:
| Transaction | Selling Entity | Buying Entity | Transfer Price | Cost to Group | Unrealised Profit |
|---|---|---|---|---|---|
| Raw materials | Entity A (factory) | Entity B (processor) | £120,000 | £80,000 | £40,000 |
| Finished goods | Entity B (processor) | Entity C (distributor) | £200,000 | £120,000 | £80,000 |
| Goods still in C’s stock at period end | — | — | — | — | £80,000 to eliminate |
The elimination journal for the finished goods still sitting in Entity C’s inventory needs to reverse the profit recognised in both Entity A and Entity B. In a purpose-built system this is a single structured elimination. In Excel, most workbooks handle it as two separate manual journals — one eliminating A’s profit on the raw material transfer, one eliminating B’s markup on the finished goods. The risk is that the cost basis travelling through the chain becomes misaligned: if either journal uses a slightly wrong figure, the consolidated inventory balance is wrong and the group profit is wrong, often in ways that aren’t immediately obvious from the balance sheet check.
The journal that should be posted to eliminate the unrealised profit in Entity C’s inventory looks like this:
Dr Cost of Sales £80,000
Cr Inventory (closing stock) £80,000
Elimination of unrealised intercompany profit embedded in Entity C’s period-end inventory. The full £80,000 represents the cumulative markup from Entity A → Entity B → Entity C. Both legs must be traced to ensure the cost-of-sales credit is correctly allocated across the chain.
In Excel, there is no structural enforcement that this journal correctly traces back to the original cost. It’s a manual entry. If the person who built the workbook leaves, or if anyone changes a figure in Entity A’s trial balance after the elimination has been posted, the journal becomes wrong silently. The workbook will still calculate — it just won’t calculate correctly. You can read more about why intercompany elimination is the foundation of any group consolidation and how the complexity scales.
Common mistake: Many Excel consolidation workbooks eliminate only the immediate intercompany pair — the invoice and the corresponding payable/receivable — without separately checking whether any margin from that transaction is still sitting in closing inventory at any entity in the group. As the number of intercompany trading relationships grows, this check becomes systematically unreliable without a dedicated data structure to track it.
Failure Mode 2: Multi-Currency Translation Is Incompatible with a Static Workbook
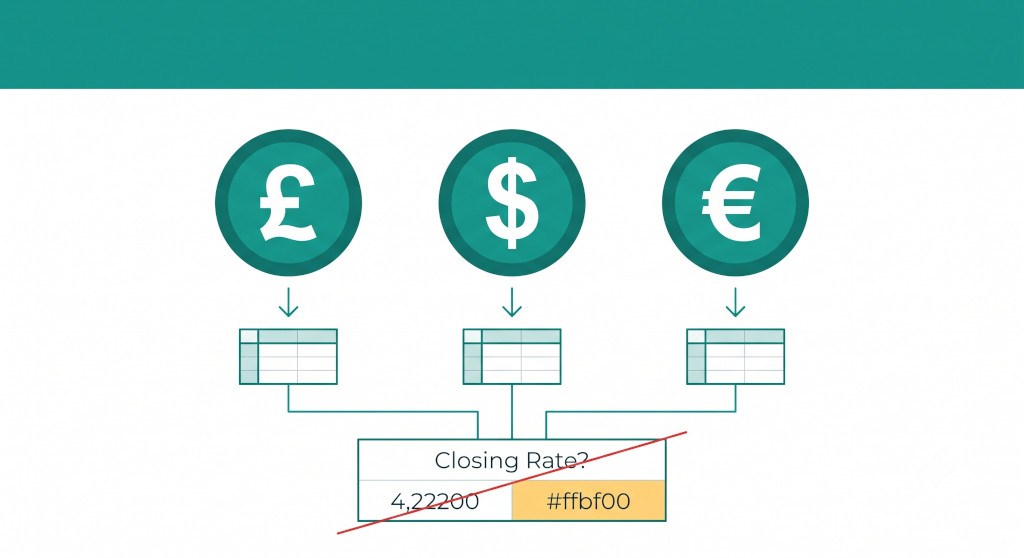
Sterling-only groups can consolidate in Excel without ever worrying about translation. The moment a foreign currency subsidiary arrives, the workbook needs to do something structurally different: translate the subsidiary’s balance sheet at the closing rate, translate its P&L at the average rate, and recognise the difference — the cumulative translation adjustment, or CTA — directly in other comprehensive income, not in profit or loss.
Most Excel workbooks handle this by adding a translation tab for the foreign entity. The problem emerges not in the first period, but in subsequent periods. The CTA is a cumulative balance. It needs to roll forward from the prior year’s closing CTA, be adjusted for the current period movement, and — if there has been any partial disposal or step acquisition — be partially recycled to P&L. Each of these steps requires the workbook to correctly link back to prior-period data, which in a cell-reference-based structure means the prior year tab needs to be kept intact and correctly referenced.
In practice, what happens is this: someone copies last year’s workbook to create this year’s. They update the entity trial balances. But the prior-year closing rate used in the translation tab is now a hard-coded number in a cell somewhere, because it was “correct as at last year.” If that cell gets overwritten — or if someone uses a slightly different rate than the one actually used in the prior year — the CTA roll-forward is wrong from that point forward, and the error compounds with every subsequent period.
CTA Roll-Forward (simplified, one foreign subsidiary): Opening net assets at prior closing rate £1,240,000 + Current year profit at average rate £ 87,000 – Dividends paid at transaction rate £ (22,000) = Closing net assets at current closing rate £1,358,000 ────────────────────────────────────────────────────── CTA movement for the year £ (53,000) (recognised in OCI, not P&L)
That calculation requires four distinct exchange rates to be correct and consistent across two periods. In a single-currency workbook, there are no exchange rates. Add a second foreign currency entity, and you now have eight rates to track across two periods. Add a third — perhaps the Singapore subsidiary — and you’re at twelve. The probability of a rate inconsistency somewhere in the workbook grows with every entity and every period. For a detailed explanation of why the CTA goes to OCI and how to calculate it correctly, see our guide to calculating the CTA in group consolidation.
Failure Mode 3: Non-Controlling Interests Turn One Calculation into a Project
A wholly-owned group consolidation is hard enough. The moment one subsidiary has a minority shareholder — even a small one — the consolidation has to split every P&L line and every equity movement between the group’s share and the NCI’s share. In a purpose-built tool, this is a configuration setting. In Excel, it’s a manual calculation that needs to be applied to every relevant line across every affected subsidiary.
The NCI calculation is not just a final-line adjustment. It affects the consolidated statement of changes in equity, the allocation of the current-year profit, the NCI’s share of any dividends declared by the subsidiary, and — if the subsidiary is also a foreign entity — the split of the CTA between the parent’s share and the NCI’s share. That last point is particularly prone to Excel error: most workbooks allocate the full CTA to the parent’s equity and either ignore the NCI’s CTA share or hard-code it separately, leading to an equity reconciliation that is subtly wrong every period.
For a group that started with 100% ownership of all entities and then acquires a 75% stake in a new subsidiary, the NCI calculation sequence looks like this:
- Identify the NCI percentage (25%) and the subsidiary’s net assets at acquisition.
- Calculate the NCI’s share of post-acquisition retained earnings each period.
- Calculate the NCI’s share of the current-year profit from the subsidiary’s P&L.
- If the subsidiary is a foreign entity: split the CTA between parent (75%) and NCI (25%).
- Adjust for any dividends paid to the NCI during the year.
- Carry the NCI balance forward correctly to the next period’s opening position.
Each of those six steps requires a correctly structured Excel formula linked to the right prior-period tab. If any link is broken — or if the workbook was copied from a prior year in which the NCI percentage was different — the entire NCI column in the equity statement will be wrong. You can read a detailed worked example of how to calculate NCI in group consolidation, including the equity method and fair value method comparison.
Failure Mode 4: Different Accounting Policies Across Entities Break Your Chart of Accounts Mapping
When all entities use the same accounting standard and the same chart of accounts, consolidation is largely mechanical. When Entity 5 arrives reporting under IFRS while the parent reports under UK GAAP, or when Entity 6 capitalises development costs while the parent expenses them, you have a policy alignment problem that Excel cannot solve structurally.
What typically happens is that someone manually posts an adjusting journal in the consolidation workbook to convert the subsidiary’s reported figures to the group standard. That journal is documented, usually in a comment or a separate notes tab, and it works correctly in the first period. The risk is that it becomes invisible over time: if the subsidiary changes its figures after the adjustment has been posted, the adjustment doesn’t update automatically. If the person who documented it leaves, the rationale for the journal is lost. And if the adjustment affects a balance sheet item — say, a lease liability that the subsidiary recognises under IFRS 16 but which is not recognised under the parent’s accounting standard — it needs to roll forward period after period, with the correct amortisation applied each time.
Policy alignment journals are not one-off entries. They are structural adjustments that need to be applied consistently, updated as underlying figures change, and documented with enough clarity that any auditor can reconstruct the logic from scratch. Excel provides no enforcement of any of those requirements.
The chart of accounts mapping compounds this. A subsidiary acquired through an acquisition often has its own account codes that don’t map directly to the group’s common chart of accounts. In Excel, this mapping is maintained manually — typically via a VLOOKUP or INDEX/MATCH table. Every time the subsidiary adds a new account code (which happens regularly during integrations), someone has to remember to update the mapping table. If they don’t, that account’s balance is excluded from the consolidation silently. The trial balance totals correctly in Excel; it’s simply missing a line. See our detailed guide on how to design a common chart of accounts for multi-entity groups for a structured approach to this problem.
Failure Mode 5: No Audit Trail Means No Defensible Close
This failure mode is different from the others because it doesn’t produce an incorrect number — it produces an un-auditable process. When an auditor asks “why does this consolidation journal exist, and who approved it?” the answer in an Excel workbook is, at best, a comment in a cell that may or may not have been updated. At worst, it’s a phone call to the person who built the workbook three years ago.
As groups grow and the consolidation workbook becomes more complex, two things happen simultaneously: the number of manual adjustments increases, and the institutional knowledge of why those adjustments exist becomes concentrated in one or two people. If one of those people leaves, the workbook becomes an archaeological site. The numbers are probably right, but proving they’re right to an auditor requires reconstructing the logic from first principles.
For groups approaching external audit — or those already under audit — this is not a theoretical risk. Auditors are increasingly asking for structured evidence of consolidation adjustments: who posted them, when, against which source document, and who reviewed them. A cell comment in an Excel workbook is not structured evidence. For a practical guide to preparing consolidated financials for audit, see How to Prepare for Audit with Consolidated Financials.
Ready to see what a purpose-built consolidation looks like?
BrizoConsol handles eliminations, currency translation, NCI, and audit trail automatically — for groups of any size, connected directly to Xero, QuickBooks, MYOB, and Zoho Books.See It In Action
Why the Failure Modes Compound
Each of the five failure modes above is manageable in isolation. A four-entity sterling group with one foreign subsidiary can probably maintain a workable multi-currency tab. A group with one NCI can maintain the NCI calculation manually if the person doing it is careful. The problem is that these failure modes almost never arrive independently.
International acquisitions typically bring all of them at once: a new currency (failure mode 2), a potentially different accounting standard (failure mode 4), and in many cases a partial ownership structure (failure mode 3). The intercompany trading relationships multiply (failure mode 1), and the number of manual judgements embedded in the workbook grows with every period (failure mode 5). At a group of four entities, the workbook might contain fifty manual judgement points. At eight entities, it can easily contain three hundred — and each one is a potential failure point that is invisible until it triggers.
This is not a failure of the individual accountant. Rachel’s workbook was good. The problem is structural: Excel is a general-purpose tool and consolidation is a specific process. The more the process diverges from the simple case for which Excel is well-suited, the more the gap between “the workbook calculates” and “the workbook calculates correctly” widens. As explored in 10 Signs You’ve Outgrown Excel for Financial Consolidation, the warning signs are often visible before the actual breakdown — but they’re easy to dismiss when the workbook still opens without errors.
The real cost is not the incorrect number itself — it’s the time spent finding it. Finance teams that cut consolidation time from days to hours typically report that the majority of their old Excel time was spent on reconciliation and error-chasing, not on analysis. The workbook was producing the output; the people were providing the error-correction layer on top of it.
What Breaking Point Actually Looks Like
It rarely happens as a sudden crash. It usually looks like this: the close takes progressively longer each month. A specific cell keeps needing to be manually overridden. One entity’s trial balance doesn’t paste cleanly and requires reformatting before it can be imported. The CTA check at the bottom of the translation tab keeps showing a small unexplained difference — £3,000 or £8,000 — that gets manually zeroed out because nobody has time to find the cause. Then one month the difference is £400,000, and the close takes eleven days instead of three.
The moment the unexplained difference can no longer be confidently attributed to a rounding issue, the workbook has broken. Not because it stops calculating, but because the people maintaining it can no longer confidently attest that it’s calculating correctly. That’s the real breaking point — and it tends to arrive not at entity six or entity eight, but at whatever the point is where the next manual adjustment would require understanding all the previous ones in order to post it correctly.
If your group is approaching that point, the checklist below is the right starting place.
Practical Checklist: Diagnosing Your Excel Consolidation’s Risk Profile
- Count your intercompany pairs. If you have more than six entities with regular intercompany trading, map every pair explicitly. Any pair that isn’t tracked in a structured table is a potential elimination gap.
- Audit your exchange rates. For every foreign currency entity, confirm that the closing rate used in the current period matches the closing rate used as the opening rate in the prior period. Any discrepancy generates a spurious CTA movement.
- Trace your NCI calculation back to acquisition date net assets. The NCI’s share of post-acquisition retained earnings needs to be re-derivable from first principles. If you can’t do that in under thirty minutes, the calculation is at risk.
- List every policy alignment journal in the workbook. For each one, confirm it has been updated for the current period’s source figures and that the roll-forward (for balance sheet items) is correct.
- Check your chart of accounts mapping for unmapped accounts. Run a reconciliation of the subsidiary’s trial balance total against the sum of all mapped lines in the consolidation workbook. Any gap represents an excluded balance.
- Count the manual overrides in the current period’s workbook. If the answer is more than ten, you have an audit trail problem. Each override should have a documented rationale that an external party could verify.
- Ask who else can run the close independently. If the answer is nobody, or if the answer requires at least two weeks of handover documentation, the process is too dependent on individual knowledge.
If more than three of these checks reveal a problem, the risk profile of your Excel consolidation is high enough to justify evaluating a purpose-built alternative. Not because Excel is failing today, but because the next acquisition — or the next departure — will likely push it past the point of recovery. For a structured view of what to look for in consolidation software, see How to Choose Group Reporting Software: A Buyer’s Guide for Finance Leaders.
The goal is not to abandon Excel entirely — it remains an excellent tool for analysis, modelling, and ad-hoc reporting. The goal is to move the consolidation process itself onto a foundation that can handle the structural complexity of a growing group without relying on individual vigilance to compensate for the tool’s architectural limits. Rachel’s eleven-day close was not a failure of diligence. It was a failure of infrastructure.
See how BrizoConsol handles multi-entity consolidation
Purpose-built for SME groups — automatic eliminations, multi-currency translation, NCI, and a full audit trail. Connect your accounting software and run your first consolidated report in hours, not weeks. Start Free Trial