What Should a Group Board Pack Include?
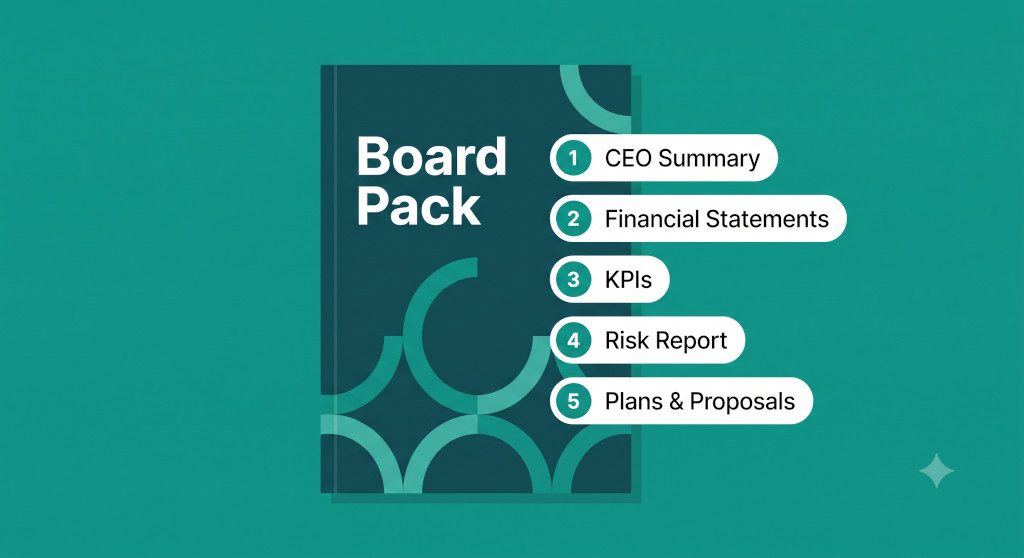
There are two ways a board meeting can go wrong before it starts. The first is when directors receive a 60-page PDF of raw financial statements the night before the meeting with no narrative, no comparison, and no indication of what requires their attention. The second is when they receive a polished 80-page document that takes three hours to read but contains nothing that actually requires a decision.
A good group reporting pack sits between those two failure modes. It gives directors the context they need to understand performance, the analysis they need to identify what has changed and why, and the proposals they need to make decisions — all in a format that respects the fact that most board members will have thirty minutes to read it on the train.
This post walks through what each section of a well-structured group reporting pack should contain and why. It follows the structure of our sample board pack, which you can download at the end of this post and use as a reference for your own reporting.
Stop building consolidations in spreadsheets.
BrizoConsol automates multi-entity consolidation — setup in minutes, reports the same day.
The Governance Sections: Attendees, Agenda, and Minutes
These three sections are often treated as administrative overhead — sections the finance team produces out of obligation rather than intent. That’s a mistake. Governance sections serve a real purpose: they establish the legal and procedural record of the meeting, ensure accountability for prior decisions, and frame the meeting for every attendee before the financial content begins.
Attendees should record not just who is present but their role (chair, independent non-executive, investor director, executive guest) and any apologies. This creates the formal quorum record and helps readers of the minutes understand who was in the room for each decision.
Agenda should be timed and owner-attributed. A timed agenda with named owners (“Financial Review & Performance — CFO — 30 mins”) signals that the board’s time has been planned deliberately. It also helps the chair manage the meeting and allows the CFO to calibrate the depth of their financial review to the time allocated.
Minutes from previous meetings should include three things: approval of prior minutes as an accurate record, a status update on all outstanding action items (completed or in progress), and the formal resolutions passed. This section closes the loop on the previous meeting before the current meeting begins. Groups that skip it — or include a summary so brief it’s useless — create gaps in the formal record that become problems during audits or disputes.
The CEO Summary
The CEO summary is typically the most-read section of the board pack — and the one most likely to be written in the two hours before the pack is distributed. It deserves more care than that.
A good CEO summary does three things in three or four short paragraphs. First, it describes the current operating state of the business: what management is focused on, how the business is performing against its operating plan, and what the key risks and opportunities are. Second, it sets the context for the financial review that follows — it tells directors what to look for and what the headline movements mean. Third, it contains a clear recommendation or ask: what does the executive team want the board to note, approve, or decide today?
A CEO summary that ends with a clear recommendation (“The executive team recommends the board approve the proposed Singapore expansion subject to the limits set out in the proposal section”) is more useful than one that ends with “Management looks forward to the board’s feedback.”
The summary should be written in plain language — not financial jargon, not operational acronyms that only insiders understand. Independent non-executives and investor directors often come from different backgrounds; the CEO summary is their entry point into the organisation’s current state, and it should be readable by anyone with general business experience.
Financial Statements
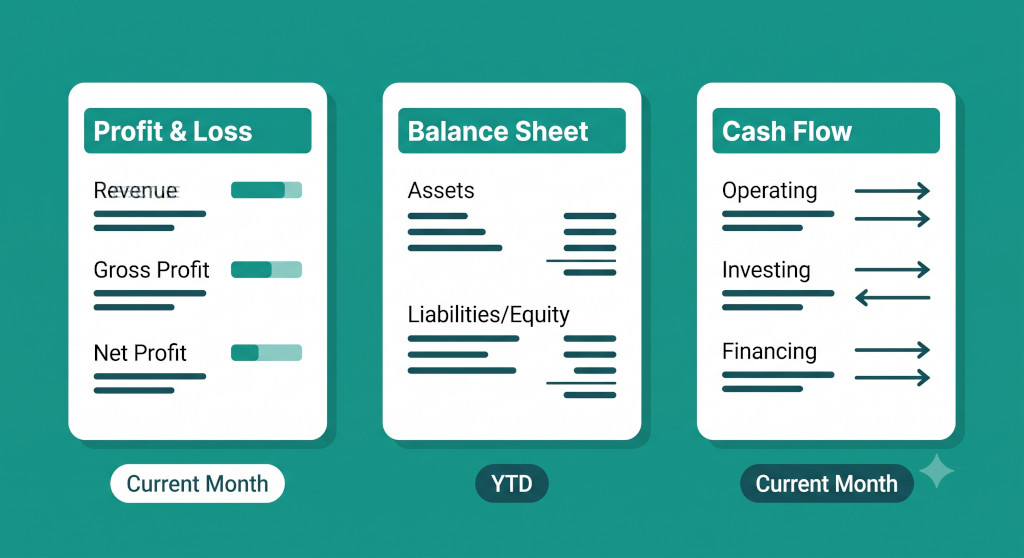
Most boards require three financial statements as a minimum: Profit & Loss, Balance Sheet, and Cash Flow. For a group reporting context, each of these should be presented at the consolidated level — after intercompany eliminations, with all entities combined — rather than as a collection of entity-level reports. The guide to group reporting for multi-entity businesses covers why consolidated statements tell a different story from entity-level financials.
Profit & Loss
The P&L should show at minimum four columns: current period actual, prior year actual, variance, and year-to-date. Many boards also find a “% of revenue” column useful for spotting margin movements quickly. The format should run from revenue through to profit after tax, with gross profit and operating profit shown as subtotals so that the gross margin and operating margin are immediately visible without calculation.
Variances should be highlighted — positive variances (favourable) in one colour, negative (adverse) in another. Directors should not need to calculate which direction a variance runs from the numbers alone.
Balance Sheet
The balance sheet should be structured to show assets, liabilities, and equity clearly, with current and non-current split for both assets and liabilities. For groups with non-controlling interests, equity attributable to owners of the parent and NCI should be presented separately. Period-end figures should be compared to the prior year equivalent — month-on-month balance sheet comparisons are generally less useful than year-on-year for a board audience.
Cash Flow Statement
The cash flow should be presented using the indirect method, structured into operating, investing, and financing activities. The net increase or decrease in cash should be clearly visible, and the reconciliation to opening and closing cash balances should be on the face of the statement. For multi-currency groups, the effect of exchange rate movements on cash should be shown as a separate line — FX movements that appear to increase or decrease cash are a common source of confusion in board discussions.
Key Performance Indicators Dashboard
The KPI section sits between the financial statements and the deeper analysis — it’s the visual summary layer that helps directors who don’t read balance sheets intuitively get oriented quickly. A well-designed KPI dashboard shows four to six headline metrics (revenue, gross profit, net profit, bank balance are common) with current period values, trend sparklines, and a comparison to the prior period or prior year.
Below the headline metrics, the dashboard should include trend charts for the most important drivers — typically revenue trend, net profit trend, and expense trend — and a breakdown of the top revenue and expense accounts. An asset allocation view (showing the split between bank, receivables, fixed assets, and other categories) helps directors understand the balance sheet intuitively even if they don’t read the balance sheet itself in detail.
The distinction between the KPI dashboard and the financial statements is audience and purpose. The financial statements are the formal record; the KPI dashboard is the discussion starter. Most boards spend more time on the dashboard than the statements, which is why it matters that the dashboard is well-designed and contains the right metrics. The guide to group KPI reporting covers how to choose which metrics belong in a board-level dashboard and which belong in operational reporting.
Profitability Analysis
The profitability section goes one level deeper than the P&L. Where the P&L shows what happened, the profitability analysis shows what it means — margin trends over time, expense-to-revenue ratios, and a written executive summary that contextualises the numbers.
The written executive summary within the profitability section is different from the CEO summary at the front of the pack. The CEO summary is strategic; the profitability executive summary is analytical. It should explain the key movements: why revenue is up or down, what drove the change in gross margin, whether the expense increase reflects a planned investment or an unexpected cost. A board that receives numbers without explanation will fill the gap with questions that eat meeting time; a board that receives numbers with clear context can focus its discussion on decisions rather than clarification.
The profitability section should also include a margin analysis table (gross profit margin, operating profit margin, net profit margin) and key ratios (expense-to-revenue, revenue growth month-on-month). For groups with multiple entities or business lines, a profitability breakdown by entity or segment adds significant value — directors can see which parts of the group are performing and which require attention.
See a Real Board Pack — Built Automatically in BrizoConsol
Download the sample board pack to see how all twelve sections come together in a single professionally formatted PDF — generated automatically from your consolidated group data. Download Sample Board Pack See It In Action
The Forward-Looking Sections: Risk, Plans, and Proposals
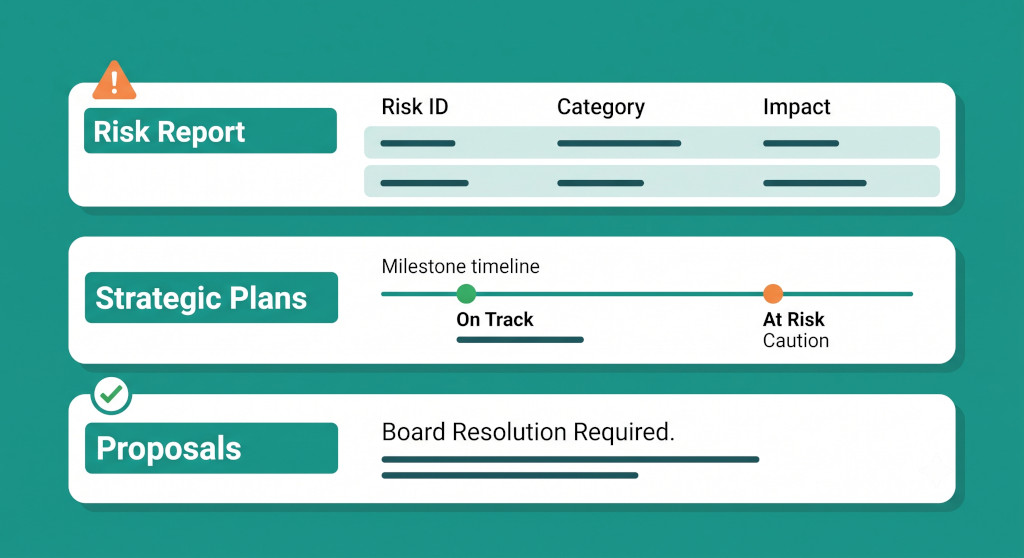
The first half of a board pack looks backward — it reports on what happened. The second half should look forward: what risks does the business face, what is management doing about them, and what decisions are required today? These three sections are what transform a reporting pack from a financial summary into a governance document.
Risk Report
The risk register presented to the board should be a curated summary of the top enterprise risks — not the full operational risk log that management uses internally. Each risk should show at minimum: a risk identifier, the risk category, a plain-English description of the risk, likelihood, impact, the current mitigation strategy, and the accountable owner.
The format matters. A risk register that is a dense paragraph of prose is harder for directors to navigate than a structured table. The table format allows directors to scan for high-likelihood, high-impact risks quickly, ask targeted questions about specific risks, and track whether mitigations are being implemented from meeting to meeting.
Committee Reports
For groups with board committees — audit & risk, remuneration, nominations — a brief summary from each committee chair should appear in the pack before the full board meeting. This is typically one page per committee: what was discussed, any findings or concerns, and the committee’s recommendations to the full board. The committee report section closes the governance loop between committee work and board awareness.
Plans and Strategic Milestones
The plans section should cover the organisation’s key strategic milestones for the period — not the full strategic plan, but the three to five objectives that are actively being managed and monitored. Each milestone should show the objective, target date, owner, and current status. Status should use clear language: On Track, At Risk, or Off Track — with a brief note on what “at risk” means and what action is being taken.
This section serves a specific governance purpose: it holds management accountable for the commitments made in prior board meetings and creates a clear record of what was planned versus what was achieved. Groups that omit a plans section often find that strategic commitments drift without consequence because they were never formally tracked in the board record.
Proposals
The proposals section is the highest-stakes section in any board pack. A proposal is a board paper that requires a formal vote or resolution — a capital expenditure approval, an acquisition mandate, a policy change, a new hire above a certain threshold. Each proposal should follow a standard format: the topic, the sponsor, the action required, an executive summary of what is being proposed, the financial and strategic impact, and a clear recommendation from the executive team.
The most important element is the action required field. Directors need to know before reading the proposal whether they are being asked to approve, reject, note, or defer a decision. A proposal that buries the ask in the conclusion forces directors to read the entire document before knowing whether their vote is needed — and that creates exactly the kind of confusion that slows meetings down and undermines good governance.
The Structure That Holds It Together
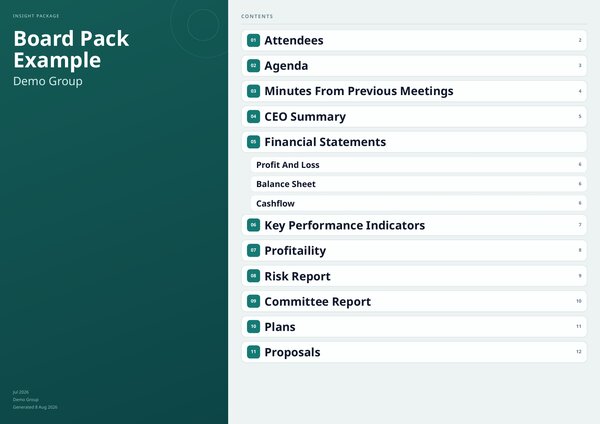
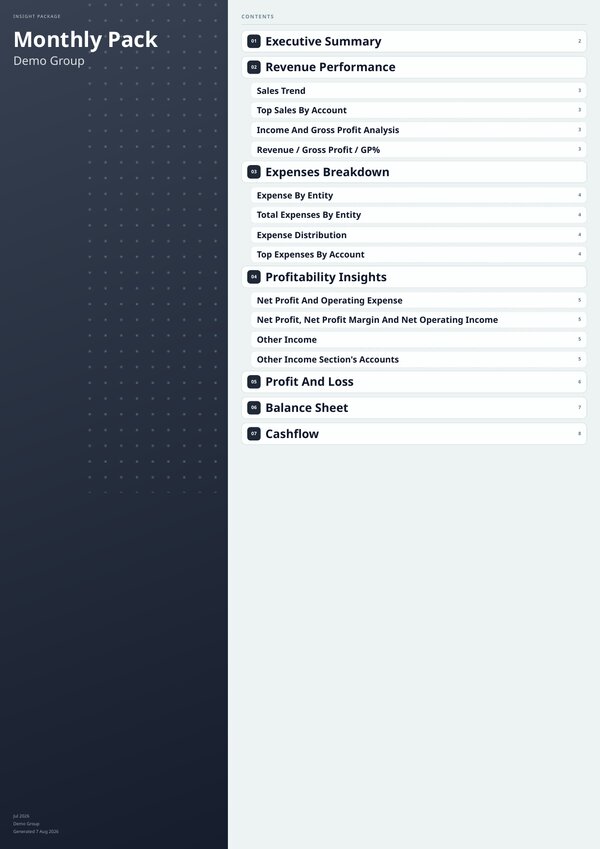
A well-structured reporting pack has three characteristics that distinguish it from a collection of financial reports. First, it has a clear table of contents with page numbers — directors should be able to navigate directly to the section they need without scrolling through the whole document. Second, it is consistently formatted — fonts, colours, table styles, and page layouts are uniform across every section, so the pack reads as a single cohesive document rather than a set of reports stapled together. Third, it has a consistent level of detail — every section is calibrated to a board audience, not an operational one.
A common structural mistake: including entity-level reports in a section labelled “financial statements.” Board packs should present consolidated group financials as the primary statements. Entity-level detail belongs in a supplementary appendix — clearly labelled as supplementary — or in a separate management report that does not go to the full board.
Producing a pack like this consistently, every month, to a tight deadline is where most finance teams struggle. The narrative sections — CEO summary, profitability commentary, risk register — require input from multiple stakeholders. The financial sections require consolidated group data that may not be finalised until late in the close cycle. The formatting requires either a template that holds its structure across contributors or a tool that generates the pack from live data. For groups using BrizoConsol’s Insight Packages, the financial sections — statements, KPI dashboards, profitability analysis — are generated automatically from the consolidated data, with the narrative sections added as text blocks within the same document. The pack is assembled in one place and delivered on schedule, without manual formatting work.
For a deeper look at how group CFOs approach the process of building and distributing the board pack — including how to manage the review cycle and stakeholder sign-off — the board reporting guide for multi-entity groups covers the process in detail.
Download the Sample Board Pack
See all twelve sections — governance, financial statements, KPI dashboard, profitability analysis, risk register, strategic plans, and proposals — in a single professionally formatted PDF, generated from BrizoConsol’s Demo Group data. Download Sample Board Pack (PDF)
Build Your Board Pack Automatically
BrizoConsol consolidates your multi-entity group data and generates your board pack — financial statements, dashboards, and profitability analysis — automatically every month, ready to send to your board on schedule. Start Free Trial