Why Your Group KPI Report Shows a Different Number for Every Entity — And How to Fix It
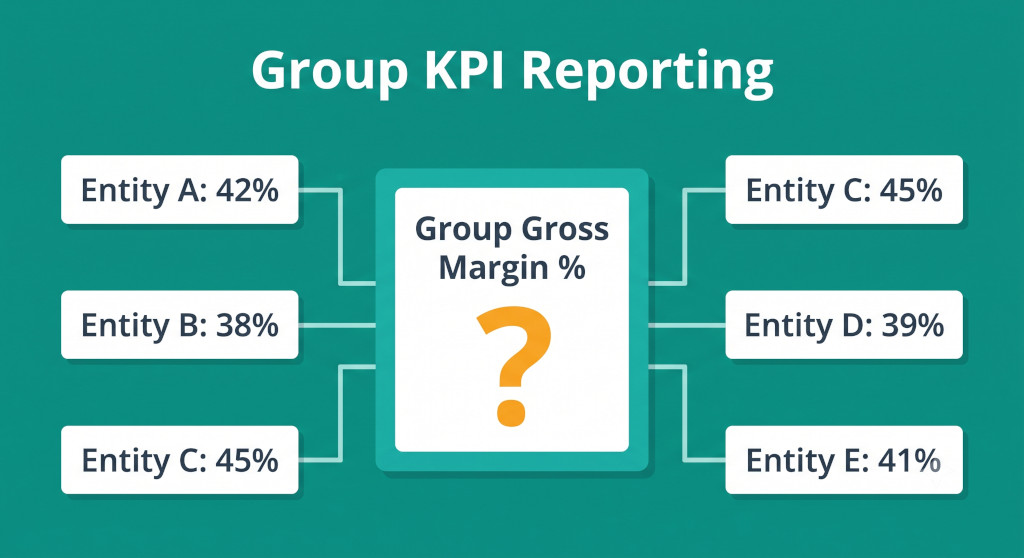
James is the CFO of a five-entity professional services group. Every quarter he sends each entity a KPI template and asks them to fill in their top ten metrics: gross margin, EBITDA margin, revenue per head, utilisation rate, debtor days, and five others. Every quarter he receives back five completed spreadsheets. And every quarter, when he tries to produce a group-level view, the numbers don’t behave the way he expects.
Entity A reports a gross margin of 42%. Entity B reports 38%. When James calculates the group gross margin by averaging the five entity figures, he gets 40.8% — a number that looks reasonable but is arithmetically wrong. Two of the five entities report headcount in full-time equivalents; the other three report the number of people on payroll, including part-timers and contractors. Entity D’s “utilisation rate” measures billable hours against contracted hours; Entity E measures billable hours against all working hours including non-billable internal time. The EBITDA figure from Entity C includes depreciation on leased vehicles that the other entities show above the EBITDA line.
None of these entities is doing anything dishonest. Each finance manager built their KPI calculation in a way that made sense for their entity’s structure and accounting system. The problem is entirely at the group level: when you combine metrics that measure subtly different things, the group number does not measure anything at all. James’s quarterly KPI report has become a source of confusion rather than insight.
Stop building consolidations in spreadsheets.
BrizoConsol automates multi-entity consolidation — setup in minutes, reports the same day.
Two Types of KPI Problem in Multi-Entity Groups
Before diagnosing the specific failures, it helps to distinguish between two fundamentally different kinds of KPI problem that appear in group reporting — because they have different causes and different fixes.
The first type is a calculation problem: the KPI is being aggregated incorrectly at the group level. The most common example is averaging ratios across entities when they should be weighted by a denominator. This is a mathematical error that produces a wrong group number even when every entity’s individual figure is correct.
The second type is a definition problem: the same KPI name conceals different calculations across entities, because each entity decided independently what to include or exclude. This is a measurement standardisation problem. The individual entity figures may each be internally consistent, but they cannot be meaningfully compared or combined.
James has both problems simultaneously, which is why his group KPI report is unreliable across every dimension — not just for one or two metrics. The calculation problem and the definition problem must be addressed separately, in that order: first fix the definitions so that all entities are measuring the same thing, then fix the aggregation so that the group number is calculated correctly from those consistent inputs.
Problem 1 — Ratio KPIs Cannot Be Averaged Across Entities
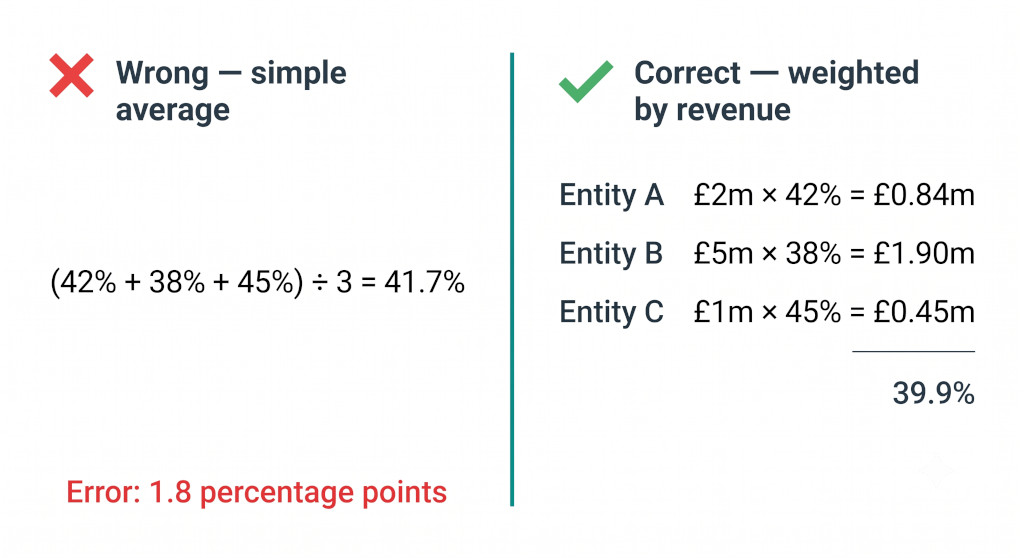
This is the most common calculation error in group KPI reporting, and it produces wrong numbers even when every entity’s individual figure is calculated correctly. The rule is simple: you cannot average ratios. A ratio must be recalculated from its aggregated components.
Consider gross margin percentage across three entities:
| Entity | Revenue | Gross Profit | Gross Margin % |
|---|---|---|---|
| Entity A | £2,000,000 | £840,000 | 42.0% |
| Entity B | £5,000,000 | £1,900,000 | 38.0% |
| Entity C | £1,000,000 | £450,000 | 45.0% |
| Group total | £8,000,000 | £3,190,000 | 39.9% |
The correct group gross margin is 39.9% — calculated by dividing total group gross profit (£3,190,000) by total group revenue (£8,000,000). If James simply averages the three entity percentages — (42.0% + 38.0% + 45.0%) ÷ 3 — he gets 41.7%. That is 1.8 percentage points higher than the correct figure, entirely because Entity B, the largest entity by revenue, is dragging the group margin down and a simple average gives it the same weight as Entity C, which is five times smaller.
The averaging error is not trivial at scale. A 1.8 percentage point error on £8m revenue overstates group gross profit by £144,000. If the board is using the group gross margin to assess whether the business is hitting its targets or to set pricing policy, they are working from a number that is systematically wrong — and the error grows larger as the revenue mix across entities becomes more uneven.
The fix for ratio KPIs is to ensure the group report is built from the underlying components — revenue and gross profit — rather than from each entity’s pre-calculated percentage. The percentage is then calculated at the group level from the aggregated totals. This applies to every ratio KPI: EBITDA margin, net margin, return on assets, revenue per head, debtor days, and any other metric expressed as a rate, ratio, or percentage. For a complete view of which metrics belong in a group KPI report and why, see our guide to group KPI reporting for multi-entity businesses.
Problem 2 — The Same KPI Name Hides Different Calculations
James’s EBITDA problem illustrates the definition issue precisely. Entity C includes depreciation on leased vehicles above its EBITDA line — as a direct cost charged to the projects the vehicles support. The other four entities treat vehicle depreciation as an overhead below the EBITDA line. Both approaches have internal logic. But the result is that Entity C’s EBITDA margin is systematically higher than a like-for-like comparison with the other entities would produce — because it is absorbing a cost that the others are not.
The same type of inconsistency appears across virtually every financial KPI in a multi-entity group that has allowed entities to define their own metrics:
| KPI | Common Variation 1 | Common Variation 2 | Impact on Group Figure |
|---|---|---|---|
| Gross Margin % | Includes inbound freight in cost of sales | Excludes freight (classified as overhead) | Entities excluding freight show higher margin — not comparable |
| EBITDA Margin % | Excludes lease depreciation (IFRS 16 / AASB 16) | Includes lease depreciation in operating costs | IFRS-adjusting entities show higher EBITDA — standard difference |
| Debtor Days | Calculated on closing trade receivables ÷ annual revenue × 365 | Calculated on closing receivables ÷ last 3 months revenue × 90 | Seasonal businesses produce materially different figures under each method |
| Revenue per Head | Revenue ÷ FTE headcount (contractors excluded) | Revenue ÷ all people on payroll (contractors included) | Entities with high contractor mix appear more productive under method 2 |
| Utilisation Rate | Billable hours ÷ contracted hours | Billable hours ÷ total working hours | Method 2 always produces a lower rate — entities incomparable |
The critical point is that none of these entity-level choices is necessarily wrong. An entity that classifies inbound freight as a direct cost is applying a defensible accounting policy. The problem arises when that entity’s gross margin is placed alongside an entity that treats freight as overhead, and the two percentages are presented as if they measure the same thing. They do not.
Definition inconsistency is invisible in the individual entity reports, where every number is internally consistent. It only becomes visible at the group level, where the comparison reveals the difference. This is why group-level KPI problems are so often discovered late — they require the combined view to manifest.
Problem 3 — Non-Financial KPIs Are the Most Inconsistently Defined
Financial KPIs at least have accounting standards as a partial constraint. Gross profit has a broadly understood meaning; EBITDA has a recognised definition even if entities adjust it differently. Non-financial KPIs — headcount, utilisation, customer count, NPS, staff turnover — have no such anchoring. Each entity defines them however its management team found most useful when they first started tracking them, and the resulting variations across a five-entity group can be dramatic.
Headcount is the clearest example. James’s group has two entities reporting FTEs (full-time equivalents, where a 0.5 FTE is half a role) and three entities reporting bodies (where a part-timer and a full-timer each count as one). For revenue-per-head calculations, the FTE approach is almost always more meaningful — a part-timer generates half the hours but the same headcount under the body-count method, making the entity’s revenue-per-head look artificially high. But if three of five entities are using the body-count method, converting retrospectively is a significant data exercise.
Customer count is similarly treacherous. One entity counts active customers (anyone who has purchased in the last 12 months). Another counts all customers with an active contract. A third counts all accounts in the CRM, including prospects. None of these is wrong for its intended purpose. All three are incomparable at the group level.
Staff turnover is another. One entity calculates it as leavers in the period ÷ average headcount. Another calculates it as leavers ÷ opening headcount. In a growing entity, average headcount is higher than opening headcount, so the first method always produces a lower turnover rate — making the entity look like it retains staff better than the second method suggests.
The fix for non-financial KPIs is the same as for financial ones: a group definition dictionary that specifies the exact formula, the data source, and what is included and excluded, before any entity starts measuring. The difference is that for non-financial KPIs, the group finance team typically needs to involve HR, operations, and commercial leadership in the definition process — because the metric is owned by those functions, not by finance.
Stop rebuilding KPI reports from scratch every quarter
BrizoConsol pulls financial data from all your entities, calculates group-level KPIs from the underlying components, and presents a consistent view across every entity — with the definitions you set, applied automatically.See It In Action
Problem 4 — Currency Distorts Cross-Entity KPI Comparisons
For groups with foreign-currency entities, ratio KPIs have an additional complication: the translation rate used for actuals affects the ratio, even when the underlying performance is identical.
Consider two entities with identical operational performance — both achieve a 40% gross margin in their local currency. Entity A operates in AUD. Entity B operates in GBP. When GBP strengthens against AUD, Entity B’s revenue and gross profit both translate to higher AUD figures, but the ratio — 40% — is unchanged, because the numerator and denominator are affected equally. This means gross margin percentage is currency-neutral and can be compared across entities without adjustment.
Revenue per head, however, is not currency-neutral. Entity B’s revenue in GBP, translated to AUD at a strong GBP rate, produces a higher revenue-per-head figure in the group currency than it would at a weaker rate — even if the entity is generating exactly the same GBP revenue and employing exactly the same headcount. When comparing revenue-per-head across entities in different currencies, the comparison is only meaningful if all figures are expressed in local currency, or if the group makes an explicit note that the comparison is affected by the translation rate used.
The practical rule for multi-currency groups: ratio KPIs whose numerator and denominator are both monetary can be compared across currencies without adjustment (the ratio is the same regardless of translation). Absolute KPIs expressed in group currency (revenue, EBITDA in dollar terms, revenue per head) must be treated as translation-affected and noted as such when comparing entities. For a deeper explanation of how currency translation works in the context of group reporting, see our guide to currency translation under IAS 21, ASC 830, and FRS 102.
How to Build a Group KPI Definition Dictionary
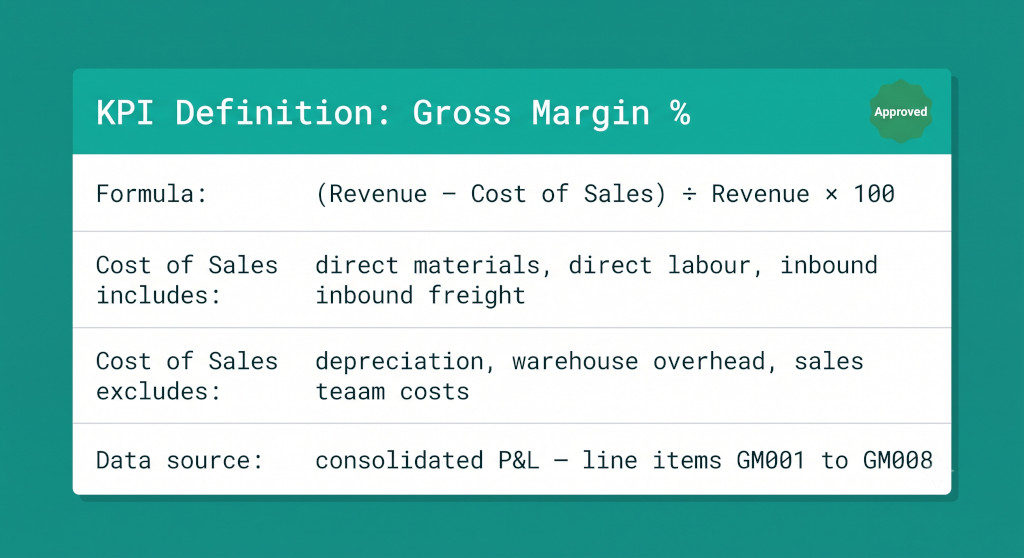
The single most effective intervention for a group KPI reporting problem is a definition dictionary: a document that specifies, for every KPI the group tracks, exactly what it measures and exactly how it is calculated. The dictionary becomes the authoritative reference for every entity finance manager, every group report, and every board pack.
Each entry in the dictionary should answer five questions:
- What does this KPI measure? A one-sentence description of the business question the KPI answers — not the formula, but the intent. “Measures the proportion of revenue retained after the cost of delivering the product or service.”
- What is the formula? The exact calculation, expressed as a fraction or percentage with numerator and denominator named explicitly. “(Revenue − Cost of Sales) ÷ Revenue × 100.”
- What is included in each component? A positive list of what belongs in the numerator and denominator. “Cost of Sales includes: direct materials, direct labour, subcontractor costs, inbound freight.”
- What is excluded? An explicit negative list of what does not belong. “Cost of Sales excludes: depreciation, warehouse overhead, sales team salaries, marketing spend.”
- What is the data source? Which line items in the group chart of accounts, or which system fields, feed this KPI. “Sourced from consolidated P&L lines GM001–GM008 as defined in the group chart of accounts.”
The data source requirement is what connects the KPI dictionary to the group chart of accounts — and why the common chart of accounts design is a prerequisite for reliable group KPI reporting. If the underlying account structure is inconsistent, the KPI dictionary cannot enforce consistent measurement, because the data it draws from is already inconsistent at the source.
The dictionary should cover every KPI the group tracks — financial and non-financial — and should be signed off by both the group finance team and the operational leadership responsible for non-financial metrics. Once agreed, it should be distributed to every entity finance manager before the next reporting cycle opens, with a clear instruction: if your current calculation differs from the dictionary definition, you need to adjust your approach going forward, and flag any historical restatements required for prior periods.
Pre-Reporting Checklist for Group KPI Consistency
Once the definition dictionary is in place, the monthly or quarterly KPI reporting cycle needs a structured consistency check before the group numbers are presented to the board. The following steps catch the most common failures.
- Verify that no entity has averaged ratios before submission. Ask each entity to submit the underlying components (revenue, gross profit, headcount) as well as the calculated ratio. Recalculate the ratio at the group level from the aggregated components. If the group ratio differs from the average of entity ratios, the group-level calculation is correct and the average should not be used.
- Check for definition drift. For each KPI, compare the entity submissions against the definition dictionary. If any entity has changed a classification since the last reporting period — for example, moving a cost line above or below the gross profit line — flag it, quantify the impact, and request either a restatement or a disclosure note explaining the change.
- Confirm the non-financial KPI basis. For headcount, utilisation, and any other non-financial metric, confirm the basis used by each entity matches the dictionary. Where entities historically used different methods, confirm that the transition to the standard method has been applied consistently from the agreed start date.
- Apply the currency rule. For multi-currency entities, identify which KPIs are currency-affected (absolute figures in group currency) and which are currency-neutral (ratios where numerator and denominator move together). Flag currency-affected comparisons in the report so the board is not drawing performance conclusions from exchange rate movements.
- Sense-check outliers before presenting. Any entity showing a KPI significantly above or below the group range warrants investigation before the board sees it. The question is always: is this a genuine performance difference, a definition deviation, or a data error? Only the first of these belongs in the board commentary without qualification.
Steps 1 and 2 together take James’s quarterly KPI preparation from a manual assembly exercise to a structured quality control process. The additional time required is modest — typically 30 to 60 minutes of checking work per reporting cycle. The benefit is a group KPI report that the board can use to make decisions rather than to question methodology.
For how the KPI report fits into the broader group reporting pack, see our guide on what a group monthly management report should include and our post on how group CFOs build a consolidated board pack that directors can use.
What Changes When the Definitions Are Right
When James implemented a KPI definition dictionary and rebuilt the group report from consistent inputs, two things happened that he did not expect. First, several KPIs moved — some materially. The group gross margin fell by 1.8 percentage points once the ratio aggregation was corrected. The EBITDA margin for Entity C fell by 2.1 percentage points once vehicle depreciation was moved to a consistent position below EBITDA. These were not performance changes. They were measurement corrections — but they looked like bad news until they were properly explained.
Second, the board started asking more useful questions. Previously, the discussion had been about whether the numbers were right. After the restatement and with the dictionary in place, the discussion shifted to what the numbers meant and what management was doing about the underperforming entities. That shift — from questioning the measurement to using the measurement — is the real return on the investment of building a definition dictionary.
The group KPI report is only as useful as the definitions underneath it. Getting those definitions right is not a reporting project. It is a data governance project, and it belongs at the foundation of how the group measures its own performance.
Group KPI reporting that starts from consistent data
BrizoConsol consolidates entity financials into a common structure, calculates group KPIs from aggregated components rather than averaged ratios, and surfaces the results in a board-ready format every reporting cycle. Start Free Trial