How to Prepare a Group Reporting Package From Consolidated Data
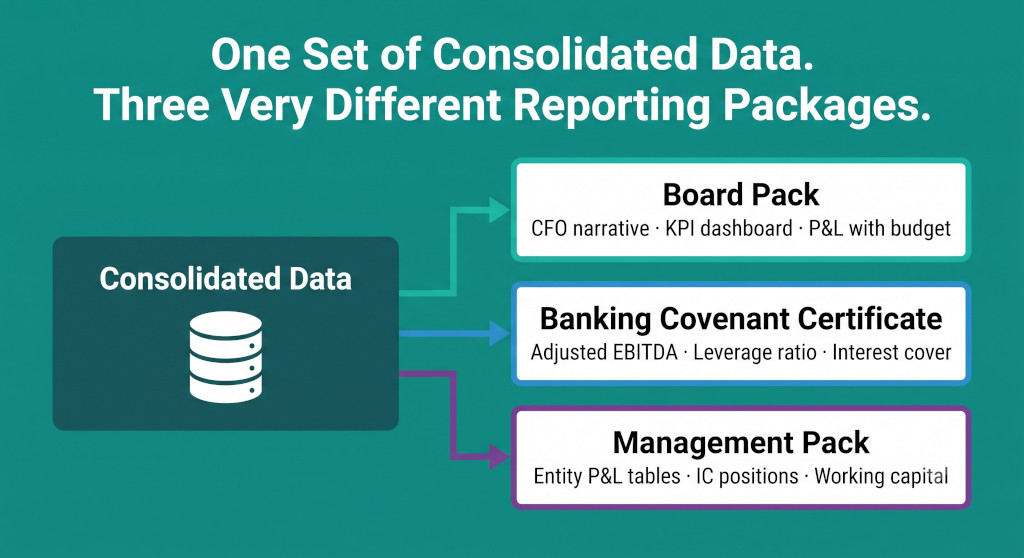
Harriet closed the consolidation model at 7pm on a Thursday — three days after the quarter end — and opened a blank document. The consolidation was done: aggregated, eliminated, adjusted, and reviewed. The consolidated income statement, balance sheet, and cash flow were correct. But the consolidation itself was not the deliverable. What the group’s stakeholders actually needed — the board, the bank, and the fifteen subsidiary managing directors scattered across three countries — were three entirely different documents, each drawing from the same underlying data, each requiring different formatting, different emphasis, and in one case a different definition of the group’s most important financial metric.
Northland Group, where Harriet was group financial controller, was a private-equity-backed engineering services group with three reporting entities: the UK parent, Aldermoor Systems GmbH (Germany, EUR, 100% owned), and Stonebridge Services Ltd (UK, 75% owned). Every quarter, the same close cycle produced three distinct outputs that went to three distinct audiences — and the worst mistake Harriet’s predecessor had made was treating them as variations of the same document, when they were fundamentally different products serving fundamentally different purposes.
This post explains how to structure each reporting package, what each audience needs and why, and how to handle the technically complex bridge between the accounting EBITDA in the consolidated income statement and the adjusted EBITDA that determines whether the group is complying with its banking covenants.
Close your books faster every month.
BrizoConsol streamlines your month-end consolidation so your team spends less time on manual work.
One Source, Three Audiences, Three Purposes
Board Pack
- Audience: Non-executive directors, PE investors, executive management
- Purpose: Strategic oversight — is the business performing as expected, and what decisions need to be made?
- Emphasis: Narrative, YoY bridge, variances vs. budget, outlook
- EBITDA used: Accounting EBITDA (reported)
- Frequency: Monthly or quarterly
- Risk if wrong: Strategic decisions made on bad data; loss of board confidence
Covenant Certificate
- Audience: Group’s lenders (banks, debt funds)
- Purpose: Compliance — is the group within its debt covenants?
- Emphasis: Precise calculation, agreed definitions, numeric metrics only
- EBITDA used: Adjusted EBITDA per facility agreement definition (often significantly different from reported)
- Frequency: Quarterly (or per agreement)
- Risk if wrong: Breach, default, banking relationship damage
Management Pack
- Audience: Subsidiary MDs, operational management
- Purpose: Operational — how is each business unit performing, and what actions are needed?
- Emphasis: Entity-level P&L vs. budget, working capital, intercompany positions
- EBITDA used: Entity EBITDA (before consolidation adjustments — what the MD actually controls)
- Frequency: Monthly
- Risk if wrong: MDs manage to wrong figures; IC positions unresolved
The three audiences are not interchangeable. A board that receives a management pack format — entity-by-entity tables with no narrative and no group-level P&L — cannot do its job. A bank that receives a board pack — narrative-heavy, with accounting EBITDA and no add-back schedule — cannot calculate the covenant ratios. A subsidiary MD who receives the board pack with consolidated group numbers sees data that doesn’t match their own entity, which creates the variance confusion described in How to Explain Consolidated Variances to Management. The format must match the audience’s purpose.
Sections of the Board Pack
The board pack is the most comprehensive of the three reporting packages. Its function is to give the board everything it needs to discharge its oversight responsibilities — and nothing it doesn’t need. A board pack that contains 80 pages of entity-level detail alongside the consolidated summary has not been designed for a board; it has been designed by a finance function that has not distinguished between the data it uses to produce the accounts and the data the board needs to review them.
1. CFO Summary
2–3 page narrative. Key themes, significant variances, risk flags, outlook
2. Consolidated P&L
Actual vs. budget vs. prior year. Three-column format with variance analysis
3. Balance Sheet
Current vs. prior year. Key metrics: net debt, working capital, gearing
4. Cash Flow
Sources and uses. Free cash flow bridge. Working capital movement commentary
5. Supplementary
Entity performance tables, capex schedule, headcount, KPIs, risk register
Section 1 — CFO SummaryBOARD
What it contains: A two-to-three page narrative written by the CFO or group FC, addressing: the headline consolidated results and how they compare to budget and prior year; the key drivers of any material variance; any significant accounting or operational issues arising in the period; and the outlook for the remainder of the year.
What makes it effective: The summary should lead with the conclusion — the EBITDA performance and whether it is ahead or behind budget — rather than with methodology. Non-executive directors read the summary first and the detailed pack second, if at all. A summary that buries the headline in paragraph four and leads with methodology has failed its audience. The YoY bridge analysis described in How to Compare Current-Year Consolidated Results With Prior Year should be embedded in the narrative, not presented as a standalone appendix.
Common error: Writing the CFO summary as a description of the financial statements rather than an explanation of them. “Revenue was £21.6m and EBITDA was £5.9m” is a description. “Revenue grew 8% organically at constant currency; the 33% reported growth includes £4.3m from the Coastal BV acquisition in H2” is an explanation. The board reads the consolidated P&L itself; the summary’s job is to explain what it means.
Section 2 — Consolidated P&LBOARD + MGMT
Format: Three columns minimum: current period actual, budget for the period, prior year equivalent period. A fourth column for year-to-date is standard for quarterly reporting. Variance columns (actual vs. budget, actual vs. prior year) should show both absolute (£k) and percentage. Favourable variances in positive format; adverse in negative (or flagged in red).
Line items: Revenue, gross profit, EBITDA, EBIT (or operating profit), profit before tax, tax, PAT, profit attributable to owners, profit attributable to NCI. Margin percentages for gross profit and EBITDA should be shown alongside the absolute numbers — a revenue movement with no margin change reads very differently from a margin compression at flat revenue.
Entity-level tables: The board pack should include a condensed entity-level P&L table showing each subsidiary’s contribution to the consolidated, so the board can see which entity drove a group-level variance. These are condensed (revenue, gross profit, EBITDA only) — the full entity P&L belongs in the management pack, not the board pack.
Section 4 — Cash Flow CommentaryBOARD
What makes cash flow commentary useful: The cash flow statement is the financial statement most boards find hardest to read — and it is the one that most reliably signals operational stress before the P&L does. The commentary should translate the cash flow into operational language: “We collected £X of the prior-quarter receivables balance; EBITDA-to-cash conversion was Y%; capex of £Z was £W ahead of budget due to the accelerated fit-out of the German facility.”
Free cash flow bridge: Present a bridge from EBITDA to free cash flow (EBITDA less: working capital movement, capex, net interest, tax paid = free cash flow before debt service). This gives the board a clear view of what the business generated in cash terms before financing obligations — the most critical metric for a PE-backed or leveraged group.
The Covenant Certificate: The Adjusted EBITDA Problem
The banking covenant certificate is the most technically demanding of the three reporting packages — and the one where an error creates the most serious immediate consequence. A covenant breach, even an inadvertent one caused by using the wrong EBITDA definition, can trigger a default under the facility agreement, accelerate the debt, and damage the group’s relationship with its lenders in ways that take years to repair.
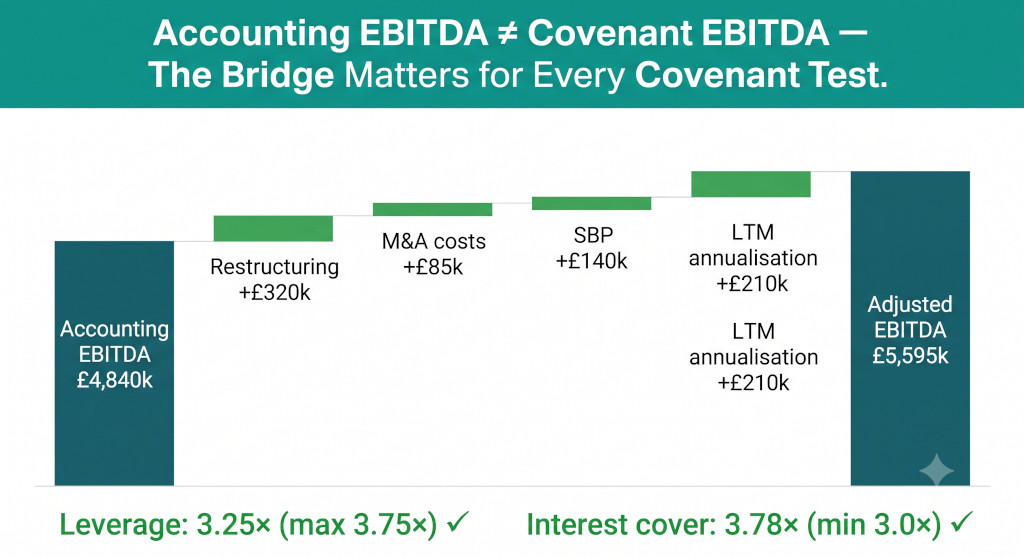
The critical distinction that group financial controllers in leveraged groups must understand is that the EBITDA used for covenant testing is almost certainly not the accounting EBITDA that appears in the consolidated income statement. Every facility agreement defines “EBITDA” specifically — typically as “Consolidated EBITDA” or “Adjusted EBITDA” — with a schedule of permitted adjustments. These adjustments are negotiated at the time the facility is arranged and are binding. Using the accounting EBITDA instead of the covenant-defined EBITDA is not conservatism — it is an error, and in a tight leverage situation, it can produce a reported covenant breach where none actually exists, or, worse, conceal a real breach.
For Northland Group, the facility agreement defines Adjusted EBITDA as consolidated accounting EBITDA plus the following permitted add-backs:
Northland Group — Q3 YTD Covenant EBITDA Bridge
Consolidated accounting EBITDA (Q3 YTD)£4,840k
Add: restructuring and reorganisation costs (exceptional, per board approval)+£320k
Add: M&A transaction costs (Stonebridge acquisition legal and advisory fees)+£85k
Add: management equity plan charge (non-cash share-based payment)+£140k
Add: LTM annualisation — Stonebridge Services (acquired Q1, 2 months pre-acquisition not in LTM)+£210k
Adjusted EBITDA (covenant definition, LTM basis)£5,595k
The four add-backs reduce to two categories: cash add-backs (exceptional and transaction costs are real cash outflows but treated as one-off by the bank, excluded from the recurring profitability view) and non-cash add-backs (share-based payment charges are an accounting cost but generate no cash, and banks typically exclude them from EBITDA). The LTM annualisation is a third category specific to acquisition accounting — discussed separately below.
Once the adjusted EBITDA is calculated, the covenant ratios can be tested:
| Covenant Metric | Definition | Calculation | Result | Covenant Limit | Status |
|---|---|---|---|---|---|
| Leverage ratio | Net debt / Adjusted EBITDA | £18,200k / £5,595k | 3.25× | Max 3.75× | ✓ Compliant |
| Interest cover | Adjusted EBITDA / Finance costs | £5,595k / £1,480k | 3.78× | Min 3.0× | ✓ Compliant |
| Leverage headroom | Distance from covenant limit | (3.75 − 3.25) × £5,595k | £2,798k | — | Adequate |
| Interest cover headroom | Distance from covenant limit | (3.78 − 3.0) × £1,480k | £1,154k | — | Adequate |
Never present covenant ratios without the headroom calculation. A leverage ratio of 3.25× against a covenant of 3.75× looks comfortable — but if EBITDA deteriorates by £1m next quarter (reducing the ratio numerator equivalent), the leverage could move to 3.65× with only 0.1× of headroom. Presenting headroom in absolute EBITDA terms (how much EBITDA can fall before breach) is more useful to the board and the CFO than the ratio alone. Harriet calculates this as a standard line in every covenant certificate: “EBITDA can fall by £2.8m before the leverage covenant is breached.”
The LTM Calculation
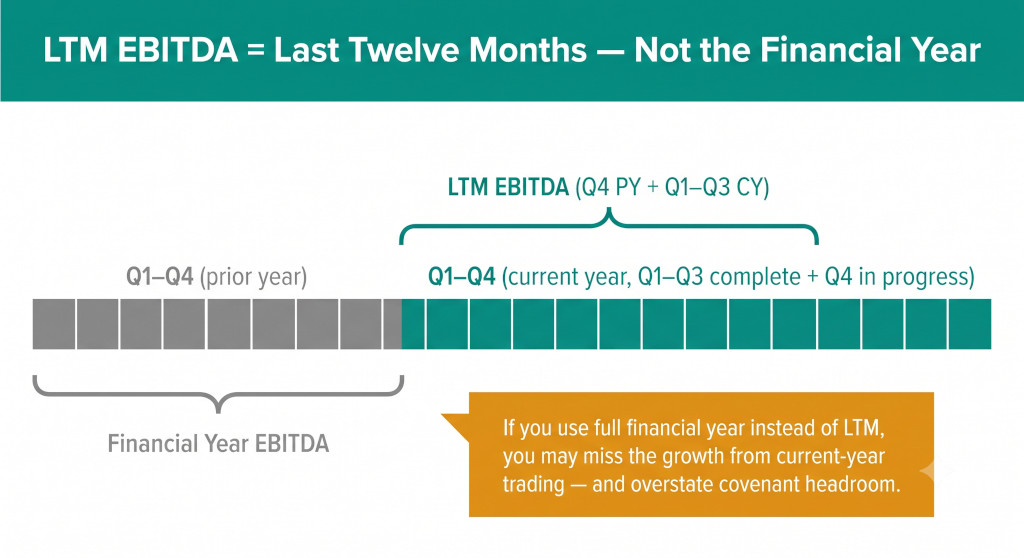
Most banking covenant agreements require the leverage and interest cover ratios to be calculated on a Last Twelve Months (LTM) basis — the rolling 12-month period ending at the test date — rather than on the annual financial year. This matters because for a group reporting on a December year-end with quarterly covenant tests, the September test date requires EBITDA for the period October previous year to September current year — crossing two financial years.
The LTM EBITDA is typically calculated as: full prior-year EBITDA, minus the prior year’s equivalent period (Q1–Q3 of the prior year), plus the current year’s Q1–Q3 actual. For Northland Group, testing at Q3 of the current year:
Northland Group — LTM Adjusted EBITDA Calculation
Prior full-year adjusted EBITDA (Jan–Dec PY)£6,820k
Less: prior year Q1–Q3 adjusted EBITDA (Jan–Sep PY)(£4,960k)
Add: current year Q1–Q3 adjusted EBITDA (Jan–Sep CY)£5,595k
LTM Adjusted EBITDA (Oct PY – Sep CY)£7,455k
Wait — the LTM of £7,455k differs from the Q3 YTD of £5,595k. This is because the LTM includes Q4 of the prior year (£1,860k: £6,820k − £4,960k = £1,860k), while the YTD does not. The leverage ratio using the LTM figure would be £18,200k / £7,455k = 2.44× — considerably better than the 3.25× calculated using the YTD. The facility agreement will specify which basis to use; both bases are shown in the worked example for completeness, and the covenant certificate must use the defined basis precisely.
The LTM calculation also requires careful attention to consolidation scope alignment. Stonebridge Services was acquired in Q1 of the current year. The Stonebridge contribution to the LTM is only the post-acquisition months (Q1–Q3 of the current year). There is no Stonebridge contribution in the prior year figures used in the LTM calculation. The facility agreement will typically permit an annualisation add-back for mid-year acquisitions — precisely the £210k line in the adjusted EBITDA bridge above — to make the LTM equivalent to a full-year contribution from Stonebridge. This add-back must be calculated carefully: it is the annualised run-rate of Stonebridge’s EBITDA for the two months before acquisition, not a full-year restatement.
The Internal Management Pack
The internal management pack is the highest-frequency reporting deliverable — typically monthly — and the one most directly useful to operational managers. Its purpose is to give each subsidiary MD and their finance team the information they need to manage their business unit: their own P&L versus budget, their working capital position, their intercompany positions with the rest of the group, and any actions arising from the previous period’s review.
The management pack for each entity should show: revenue, gross profit, and EBITDA for the entity only (not the consolidated group), compared to budget and to the prior year equivalent period; a working capital analysis (debtors days, creditor days, stock days, and absolute balances); the entity’s intercompany debtor and creditor positions by counterparty (what each entity owes and is owed by other group entities); and any open actions from the previous month’s pack.
The intercompany position schedule is the most operationally important section of the management pack, and the most frequently omitted. When intercompany balances are not reported to entity management each month, disagreements accumulate — one entity believes it is owed £180k while the other believes it owes £120k — and by the time the discrepancy surfaces, it has been running for several periods and requires significant investigation to resolve. The group financial controller should include the IC position schedule as a standing section and require each entity to confirm or flag any disagreements before the consolidation is finalised.
The entity EBITDA in the management pack will differ from the entity’s contribution to consolidated EBITDA — because it excludes consolidation-only adjustments (PPA amortisation, intercompany profit eliminations) that the MD does not control and cannot influence. This is intentional and correct: the MD should be measured against the entity EBITDA, not the consolidated contribution. The difference between entity EBITDA and consolidated contribution is a group-level accounting matter, not an operational performance matter.
Sequencing the Three Packages in the Close Cycle
The three reporting packages draw from the same consolidated data but are not produced simultaneously. The sequence matters because each package depends on data that is finalised at different points in the close cycle, and producing a package before its data is ready creates versions that need to be updated — which increases workload and creates version-control risk.
| Reporting Package | When to Produce | Data Prerequisite | Recipient Deadline |
|---|---|---|---|
| Internal management pack | Days 3–5 post-close | Entity trial balances confirmed; IC balances agreed. Consolidated not required — entity data only | Before month-end management meetings |
| Board pack | Days 6–10 post-close | Full consolidation complete and reviewed. YoY bridge prepared. CFO narrative drafted | 5 working days before board meeting |
| Covenant certificate | Days 8–15 post-close | Full consolidation complete. Adjusted EBITDA add-backs documented and authorised by CFO. Net debt confirmed | Per facility agreement (typically 45–60 days after quarter end) |
The covenant certificate is typically the last of the three to be finalised, because its deadline is the longest and because it requires the most documentation. The board pack normally goes out first — giving the board visibility of the consolidated results — while the adjusted EBITDA bridge and covenant metrics are being finalised in parallel. The management pack goes out earliest, because subsidiary MDs need their data quickly for operational decisions and because it does not require the full consolidation to be complete.
Common Errors in Group Reporting Packages
Using accounting EBITDA for the covenant test. The most consequential error. Accounting EBITDA and covenant EBITDA can differ by hundreds of thousands of pounds due to permitted add-backs. Using the wrong definition will produce wrong leverage and interest cover ratios. Always start from the facility agreement’s definition of EBITDA and build the bridge from accounting to covenant EBITDA before calculating any ratio.
Inconsistent consolidation scope between the board pack and the covenant certificate. If the board pack shows consolidated revenue and EBITDA based on one consolidation scope, and the covenant certificate uses a different scope (e.g., excluding an entity that is in the borrower group but not the reporting group, or including a recently acquired entity not yet in the board pack consolidation), the two documents will show different EBITDA figures for the same period. This is confusing for the board and creates questions from the bank. Both documents should start from the same base consolidation and show any scope differences explicitly.
Presenting entity EBITDA to the board as if it were the consolidated EBITDA. A board pack that shows the sum of entity EBITDAs without consolidation adjustments is overstating group profitability by the amount of unrealised intercompany profits and understating the impact of PPA amortisation. The board should always see the consolidated EBITDA, with a supplementary entity table showing each subsidiary’s contribution. For how to explain the difference, see How to Explain Consolidated Variances to Management.
Practical Checklist: Preparing the Group Reporting Package
- Confirm which reporting packages are due and when, at the start of each close cycle. Different quarters may have different obligations — not every quarter requires a full annual board review, and the covenant certificate deadline may vary by quarter under the facility agreement. Map the deliverables and deadlines before starting the consolidation so the close timetable is built around the output requirements, not the reverse.
- Produce the management pack first, from entity data. The management pack draws from entity trial balances, not the full consolidation. Producing it early (Days 3–5) gives subsidiary management their data promptly and surfaces any IC balance disagreements that need to be resolved before the full consolidation is run.
- Read the facility agreement’s EBITDA definition before producing the first covenant certificate. The definition is in the financial definitions section of the agreement, typically Schedule 1 or an interpretations schedule. Print it and keep it alongside the covenant calculation template. The permitted add-backs, the LTM basis, and the treatment of new acquisitions are all specified there. Do not rely on memory or on what was done in a previous period without checking the current agreement’s terms.
- Build the adjusted EBITDA bridge as a standing template updated each period. The bridge from accounting EBITDA to covenant EBITDA should be a structured template with fixed add-back rows (for recurring items like share-based payment) and variable rows (for period-specific items like restructuring). Each add-back line should reference the board minute or document that authorises the exceptional treatment. The template makes the calculation auditable and comparable period to period.
- Calculate covenant headroom in EBITDA-equivalent terms, not just ratio terms. Show how much EBITDA can decline before each covenant is breached. This is more useful than the ratio — a 0.5× of leverage headroom means very different things at £4m EBITDA vs. £20m EBITDA. Express headroom as “EBITDA can fall by £Xk before breach” alongside the ratio.
- Confirm the LTM basis with the CFO and the bank before the first quarterly test. The LTM calculation crosses two financial years and requires careful scope alignment for acquisitions and disposals. Agree the methodology with the bank at the time of the first test — some banks require the borrower to submit a pro-forma LTM with mid-year acquisitions annualised on a defined basis, rather than using the simple prior-year plus current-year formula. Do not assume the methodology without confirmation.
- Ensure the board pack consolidation scope matches the covenant certificate consolidation scope. Document any differences explicitly if they exist (for example, if the board pack excludes a dormant entity that is in the borrower group). The bank will compare the board pack EBITDA to the covenant certificate EBITDA; an unexplained difference will generate a query and potentially a default notification requirement.
- Include a YoY bridge in the board pack, not just the consolidated P&L table. The board P&L table shows the numbers; the bridge shows what drove them. For groups with mid-year acquisitions, FX effects, or disposals, the bridge is essential to prevent the board from attributing structural growth to organic performance or vice versa. Use the methodology from How to Compare Current-Year Consolidated Results With Prior Year.
- Obtain CFO sign-off on each reporting package before distribution. The board pack and covenant certificate carry the CFO’s authority — they should not be distributed until the CFO has reviewed and approved the narrative, the adjusted EBITDA calculation, and the covenant ratios. Produce the final version at least 24 hours before the distribution deadline to allow review time. For the covenant certificate specifically, the CFO signature is typically a contractual requirement under the facility agreement.
- Retain all working papers for each reporting package as a standing file. The consolidation workings, the adjusted EBITDA bridge, the LTM calculation, and the covenant compliance certificates should be retained in a structured file accessible for at least five years. Banks may request historical covenant certificates in connection with refinancings, amendments, or audits. An entity-level management pack that was distributed to subsidiary MDs may be requested in a dispute about entity performance. Treat every reporting package as an auditable document from the moment it is distributed.
By Friday morning, Harriet had all three packages in draft: the board pack with CFO narrative and YoY bridge, the covenant certificate with the full adjusted EBITDA bridge and headroom calculations, and the entity management packs for each of the three subsidiaries. The consolidated data — the same numbers in each case — had been translated into three documents that three different audiences could actually use. The bank’s compliance team received the covenant certificate by close of business Friday, seven days before the contractual deadline, with headroom of £2.8m against the leverage covenant. The board received the pack on Monday for a Wednesday meeting. The subsidiary MDs had their entity packs by Tuesday of the following week, in time for their operational reviews. No one needed to ask Clara — or Harriet — why the numbers were different from what they expected.
From consolidated data to three reporting packages — without rebuilding from scratch
BrizoConsol outputs the consolidated data in board-ready, covenant-ready, and management-ready formats — with the adjusted EBITDA bridge, the entity contribution tables, and the covenant ratios generated automatically from the same close data. No manual reformatting between packages. See It In Action
Three reporting packages. One close. No rebuilding.
BrizoConsol produces board packs, covenant certificates, and management packs from the same consolidated close data — automatically, in the right format for each audience. Start free today. Start Free Trial