QuickBooks Online Combined Reports: Why They’re Not Group Consolidation — and What Your Accounts Actually Need
Greg is the finance director of an Australian hospitality group. The group runs three QuickBooks Online Advanced companies: a HoldCo, an operating entity (OpCo) that manages three restaurants, and a property entity (PropCo) that owns the premises. Last quarter, Greg discovered QBO Advanced’s Combined Reports feature — the ability to run a single Profit and Loss report that pulls together the figures from all three QuickBooks companies side by side. He enabled it, ran the report, and felt a genuine sense of relief. Finally: a group view from within QuickBooks.
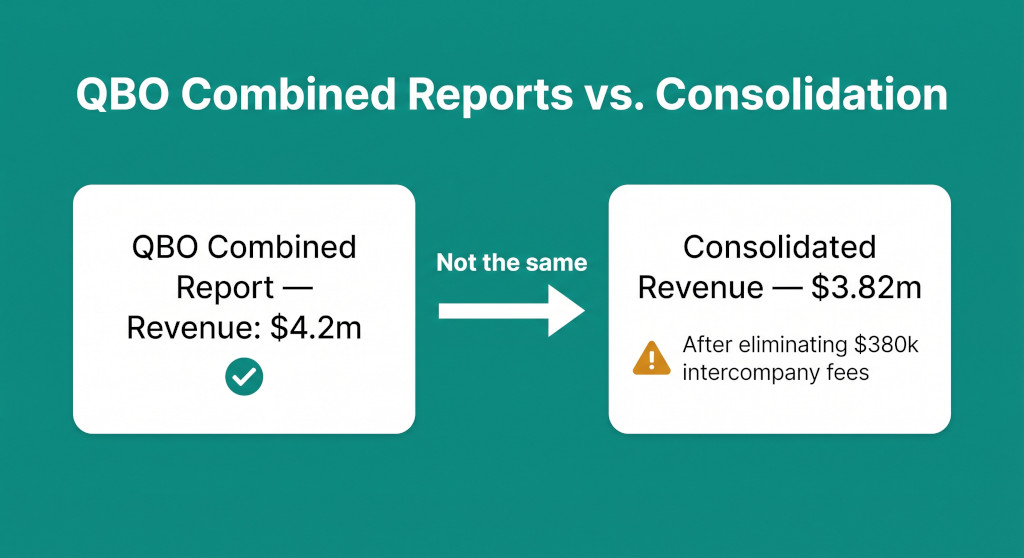
He sent it to the board under the heading “Group Management Accounts — Q4.” Three months later, the group’s auditor asked for the consolidated financial statements. Greg sent the combined report. The auditor returned it within the hour. It was not a consolidation. The combined report showed group revenue of $4.2 million. But the consolidated revenue — after eliminating $380,000 in management fees that HoldCo charged OpCo, none of which had left the group — was $3.82 million. The combined report had overstated group revenue by nearly ten per cent. And that was before the auditor got to the foreign currency impact on the Singapore property entity or the non-controlling interest calculation on PropCo, which a third party owns 20% of.
Greg’s mistake is understandable. QBO’s Combined Reports feature is well-designed and genuinely useful within its scope. The problem is that its scope and the scope of a consolidated financial statement are not the same thing — and for a group with any intercompany activity, foreign currency exposure, or minority shareholders, the gap between the two is material.
Multi-entity QuickBooks consolidation, done for you.
Connect all your QuickBooks companies and get consolidated financials instantly.
What QBO’s Combined Reports Feature Actually Does
QuickBooks Online Advanced allows users to connect multiple QBO company files and run selected reports across all of them simultaneously. In the Combined Reports view, the P&L or Balance Sheet for each company appears in its own column, with a total column that sums the rows across all companies. You can include up to ten QBO companies in a single combined report.
This is a genuine improvement over the manual process of exporting each company’s P&L to a spreadsheet and pasting them side by side. The combined report pulls live data from each QBO file, refreshes in real time, and produces a clean layout that is much easier to review than four separate exports. For internal management purposes — reviewing each entity’s revenue and cost trends quickly, spotting which entity is underperforming relative to budget — it is a practical tool.
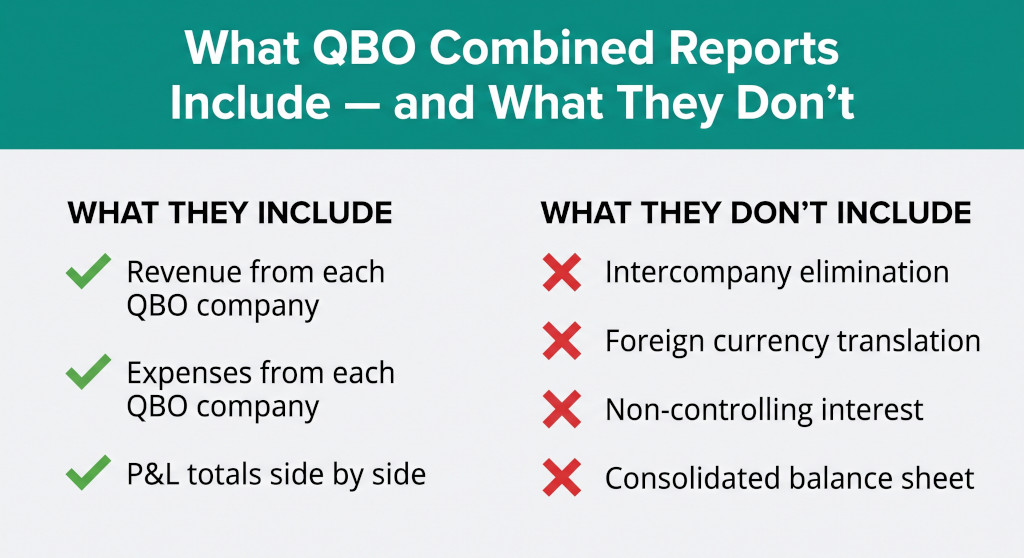
What it does not do is perform any consolidation adjustments. The total column is an arithmetic sum. Every line of revenue from HoldCo, OpCo, and PropCo is added together and presented as “group revenue.” Every line of expense is added together. There is no step that asks: of these revenues, how much was paid by another entity within the group? Of these expenses, how much was charged by another entity within the group? The combined report has no knowledge of the relationships between the QBO companies — it simply aggregates their figures.
The Intercompany Elimination Problem
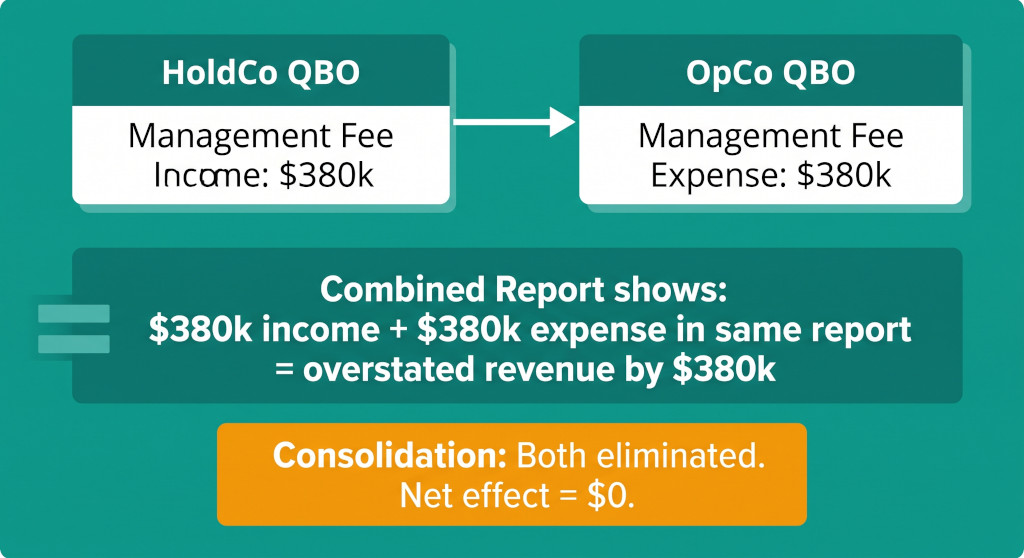
Greg’s group charges a management fee of $380,000 per year from HoldCo to OpCo. This is a legitimate internal arrangement — HoldCo provides group management, HR, and finance services, and OpCo pays for them. In each QBO company, the entry is correct: HoldCo records $380,000 of management fee income; OpCo records $380,000 of management fee expense.
The combined report includes both of these. From the group’s perspective, the income and the expense are the same transaction — money that moved from one pocket to another within the group, never touching an external party. Including both in the group accounts overstates revenue (by $380,000) and correctly states the expense — producing a misleading gross margin that is lower than the group’s true external-facing margin would be, and a revenue line that is larger than what the group actually earned from customers.
Proper consolidation eliminates both sides: the $380,000 income disappears from the consolidated P&L and the $380,000 expense disappears too. The net effect on consolidated profit is nil. But the revenue line and the expense line are both reduced by $380,000, which correctly shows that the group earned $3.82 million from external customers rather than $4.2 million from a combination of external customers and itself.
The combined report cannot perform this elimination because it has no way to identify which income lines correspond to which expense lines across different QBO companies. It does not know that HoldCo’s “Management Fee Income” account is the mirror of OpCo’s “Management Fee Expense” account. That mapping — and the elimination journals — must be maintained outside QBO, in a consolidation working paper or dedicated consolidation software. For a broader guide to how intercompany management fee eliminations work, see Intercompany Management Fee Eliminations: How to Remove Intragroup Charges From Consolidated Accounts.
The Foreign Currency Translation Problem
Greg’s group also has a Singapore entity — PropCo Singapore — that holds the lease for the Singapore restaurant location. PropCo Singapore’s QBO file is set to SGD as the base currency. When QBO’s combined report includes PropCo Singapore, it shows the SGD figures converted to AUD at whatever rate QBO applies for the display — typically the current exchange rate, not the rate required by AASB 121.
Under AASB 121, translating a foreign subsidiary for consolidation requires three different exchange rates: the closing rate for balance sheet items, the average rate for income statement items, and historical rates for equity items. The difference between translating income at the average rate for the period and at the closing rate produces the cumulative translation adjustment — a real economic number that must sit in other comprehensive income on the consolidated balance sheet. QBO’s combined report applies none of this logic. It converts SGD figures to AUD at one rate for display purposes, and the resulting numbers are neither the correct consolidation figures nor a clearly documented alternative.
A group with any foreign currency entity will find that its combined report figures cannot be used for statutory consolidated accounts — the translation has not been done correctly. The foreign currency translation must be performed in the consolidation process, using the correct period rates, and the CTA must be calculated and carried in OCI. For how this works in a QBO context, see QuickBooks Multi-Currency Consolidation: How Groups with Foreign Subsidiaries Produce Accurate Group Accounts.
QBO Group With Combined Reports That Aren’t Enough?
BrizoConsol connects to all your QuickBooks Online companies, eliminates intercompany transactions, translates foreign currencies at the correct rates, and produces consolidated financial statements — going well beyond what QBO’s combined reports can deliver. See It In Action
The Non-Controlling Interest Problem
PropCo is 80% owned by HoldCo. A third-party investor holds the remaining 20%. Under AASB 10, the group must still consolidate PropCo in full — 100% of its assets, liabilities, revenue, and expenses — because HoldCo controls the entity. But 20% of PropCo’s net assets and 20% of its profit for the year belong to the external minority investor, not to the group. This minority’s claim must be separately presented on the consolidated balance sheet (in equity, as non-controlling interest) and in the consolidated income statement (as the portion of profit attributable to NCI).
QBO’s combined report simply adds PropCo’s columns into the total, with no adjustment for the 20% minority. It treats PropCo as if HoldCo owns 100% of it. The result is a combined equity total that is larger than it should be (it includes 20% of PropCo’s equity that belongs to someone outside the group), and a combined profit figure that does not separate the group’s share from the minority’s share.
Calculating NCI requires knowing the group’s ownership percentage, the subsidiary’s net assets at acquisition and at reporting date, and any adjustments for goodwill and fair value step-ups. None of this information exists within QBO’s combined reports architecture. It must be maintained in a consolidation model external to QBO.
The Balance Sheet Problem
QBO’s combined report can produce a combined Balance Sheet as well as a combined P&L — each company’s assets and liabilities in separate columns, with a total. This has the same limitation as the P&L: the total column sums every line without any consolidation adjustments.
The most significant balance sheet adjustments that are missing:
- Elimination of HoldCo’s investment in subsidiaries. HoldCo’s QBO file shows “Investment in OpCo” and “Investment in PropCo” as assets. The subsidiaries’ QBO files show their own equity (share capital, retained earnings). At consolidation, the parent’s investment is cancelled against the subsidiaries’ equity, and the difference is goodwill. The combined report shows both the investment and the subsidiary equity — effectively double-counting the net assets of each subsidiary.
- Elimination of intercompany receivables and payables. Any loan from HoldCo to OpCo shows as a receivable in HoldCo’s QBO and a payable in OpCo’s QBO. At consolidation, both are eliminated. The combined report includes both, inflating the group’s total assets and total liabilities by the same amount.
- Goodwill from acquisition. If any subsidiary was acquired at a premium to its net assets, goodwill must appear on the consolidated balance sheet. It exists in neither entity’s QBO file and is not shown anywhere in the combined balance sheet.
The combined balance sheet does not balance in a meaningful way from a consolidation standpoint. It is the arithmetic sum of three entity balance sheets — each of which balances internally — but the total does not represent the group’s net assets, net debt, or equity position correctly.
Where Combined Reports Are Genuinely Useful
None of this means the Combined Reports feature is without value. For certain internal management purposes, it works well:
- Same-currency, no intercompany activity. If your group has multiple QBO companies that trade exclusively with external parties and no intercompany charges, loans, or dividends pass between them, the combined P&L total is arithmetically correct. Groups of this type are uncommon — most multi-entity groups have at least some HoldCo costs or shared services — but where they exist, the combined report is a reliable aggregated view.
- Individual entity comparison. The side-by-side layout — each entity in its own column — is genuinely useful for reviewing entity-level performance. Comparing OpCo’s gross margin to budget, or identifying which entity drove a variance, is easier in the combined view than in four separate exports.
- Early-stage groups. A group that has just acquired its first subsidiary and has no intercompany activity yet may find the combined report sufficient for initial internal reporting while it establishes a more formal consolidation process.
The problem is not with the feature — it is with using it as a substitute for statutory consolidated accounts when the group has intercompany activity, foreign currency entities, or minority shareholders.
The Capability Comparison
| Capability | QBO Combined Reports | Proper Consolidation |
|---|---|---|
| Aggregate P&L across QBO companies | ✓ | ✓ |
| Side-by-side entity comparison | ✓ | ✓ |
| Eliminate intercompany revenue and expenses | ✗ | ✓ |
| Eliminate intercompany loans and receivables | ✗ | ✓ |
| Cancel parent investment against subsidiary equity | ✗ | ✓ |
| Recognise goodwill from acquisitions | ✗ | ✓ |
| Translate foreign subsidiaries at correct rates | ✗ | ✓ |
| Calculate cumulative translation adjustment | ✗ | ✓ |
| Calculate and present non-controlling interest | ✗ | ✓ |
| Produce AASB 10 / IFRS 10 compliant statements | ✗ | ✓ |
If your group is required to produce consolidated financial statements — for audit, for a banking covenant, for an investor, or because AASB 10 / IFRS 10 applies — QBO’s combined reports are not a substitute. They are an internal management tool. Statutory consolidated accounts require all the steps in the right column above, none of which QBO’s combined reports perform.
What Greg Did Next
After the auditor’s feedback, Greg set up a consolidation process that runs alongside QBO — not instead of it. Each quarter, his team exports trial balances from all three QBO companies, imports them into the consolidation model, applies the intercompany eliminations and FX translations, and produces the consolidated statements from the adjusted figures. The combined report in QBO remains useful for the board pack’s entity-level performance review. The consolidated accounts go to the auditor.
For groups at Greg’s scale, a spreadsheet-based consolidation model works if the intercompany activity is well-documented and the FX rates are consistently applied. As the group grows — more entities, more intercompany flows, more currencies — the model maintenance becomes the risk. For a full overview of how the QBO consolidation process typically works and where automation adds value, see How to Consolidate Multiple QuickBooks Companies: A Practical Guide for Multi-Entity Groups.
Ready for Consolidated Accounts That Go Beyond QBO’s Combined Reports?
BrizoConsol connects directly to your QuickBooks Online companies and produces consolidated P&L, balance sheet, and cash flow statements with intercompany eliminations, multi-currency translation, and NCI — automatically, every period. Start Free Trial