Build Any Group Report You Need: The BrizoConsol Cell-Based Reporter
Standard consolidation reports answer standard questions. They show the consolidated P&L, the balance sheet, intercompany positions, and NCI balances in layouts designed to work for most groups most of the time. But every CFO has a preferred format. Every board pack has a specific structure. Every management team has a report they’ve been looking at for years — with a particular layout, a particular set of entities side by side, particular variance columns — that no off-the-shelf report quite matches.
The cell-based reporter is BrizoConsol’s answer to that problem. It gives you a true spreadsheet grid — identical to Excel in its operation, using A1 cell notation and the same formula syntax — where every cell can either hold a static label, an Excel formula, or a live data pull from BrizoConsol’s consolidated dataset. You design the report. BrizoConsol supplies the numbers.
A True Spreadsheet Grid
The cell-based reporter is not a “spreadsheet-like” interface. It is a spreadsheet. The grid uses A1 notation — column A, column B, row 1, row 2 — exactly as Excel does. Cell references work exactly as in Excel: a formula in cell F4 can reference D4 and E4, and the result updates whenever those cells change. The formula bar shows the formula or value in the selected cell, and editing works exactly as you would expect.
Stop building consolidations in spreadsheets.
BrizoConsol automates multi-entity consolidation — setup in minutes, reports the same day.
The toolbar covers the full range of formatting options available in Excel: font family and size, bold, italic, underline, fill colour, text alignment, wrap, merge and centre, number format (number, percentage, currency), decimal places, thousands separator, conditional formatting, borders (including border weight and colour), and frozen rows and columns. A report built in BrizoConsol’s cell-based reporter looks indistinguishable from one built in Excel — because the design surface is functionally the same.
Because the grid uses A1 notation and standard formula syntax, anyone who knows Excel can build a cell-based report in BrizoConsol without learning a new system. The only difference is where the data comes from: instead of typing numbers or referencing other spreadsheet files, cells pull live consolidated data directly from BrizoConsol.
Six Cell Types
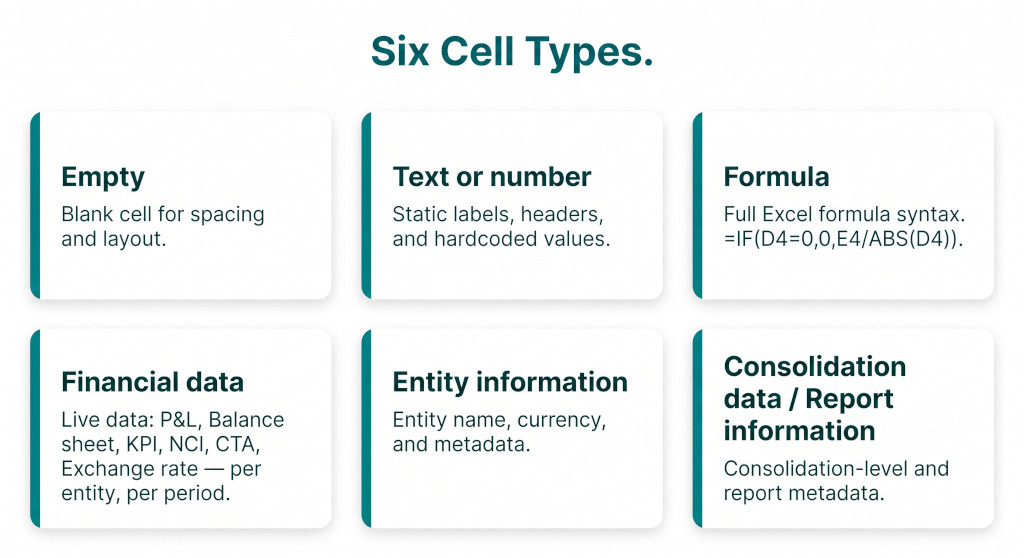
Every cell in the grid has a type — from static labels to live financial data pulls to full Excel formulas.
When you select a cell, a panel on the right lets you set its type. There are six options:
| Cell type | What it does |
|---|---|
| Empty | A blank cell. Used for spacing, visual separation, and layout control — the same as an empty cell in Excel. |
| Text or number | A static value — a row label like “Revenue”, a hardcoded assumption, a column header, or any value that does not change with the reporting period. |
| Formula | A full Excel formula referencing other cells in the grid. Supports all standard Excel formula syntax — IF, SUM, ABS, arithmetic, logical operators, and so on. Example: =IF(D4=0,0,E4/ABS(D4)) calculates a percentage variance, returning 0 if the denominator is zero. |
| Financial data | A live data pull from BrizoConsol. You specify the entity, the data source, the reporting period, and the specific metric. The cell displays the consolidated figure for those parameters, updated automatically when data is refreshed. |
| Entity information | Pulls entity metadata — name, functional currency, and other entity-level attributes — useful for dynamic column headers that update when the entity selection changes. |
| Consolidation data / Report information | Pulls consolidation-level data and report metadata — useful for automated titles, period labels, and report headers that stay current without manual editing. |
Financial Data Cells — Every Data Source, Every Entity
The Financial data cell type is the engine of the cell-based reporter. When you set a cell to Financial data, the panel on the right lets you configure four parameters:
Entity
Any entity in the group — consolidated group total, an individual subsidiary, or a specific segment. Tick “Cell reference” to drive the entity from another cell, making it easy to build reports where a single entity selector updates an entire column.
Reporting month
The period for the data — current month, year to date, prior year, or a specific month. Tick “Cell reference” to drive the period from another cell, so a single date selector updates the whole report.
Data source
The type of data to pull. Covers every dataset available in BrizoConsol — see the full list below.
Value / KPI / Account
The specific metric within the chosen data source — for example, “Revenue” within KPI, or a specific account within Profit & loss. Tick “Cell reference” to drive the metric from another cell.
The available data sources cover the full breadth of BrizoConsol’s consolidated dataset:
This means a single cell-based report can combine revenue from the P&L, a goodwill balance from the balance sheet, an NCI figure from the NCI calculation, and an exchange rate — all in the same grid, all updating together when the reporting month changes.
Demo Report One: Group Management P&L
The Group Management P&L report demonstrates how cell types combine to produce a multi-entity comparison layout that no standard report template could replicate without customisation.
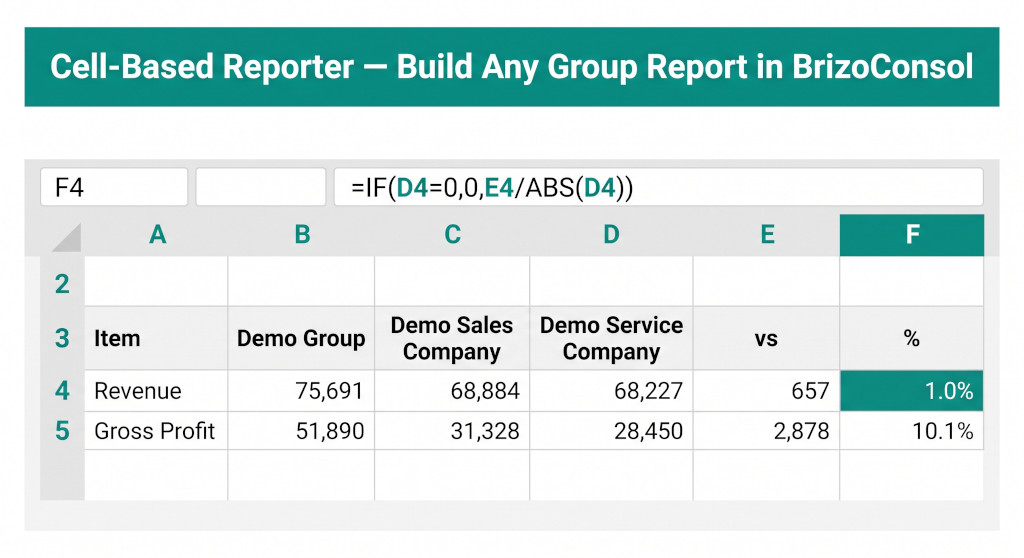
The report has six columns: Item (text labels), Demo Group total (financial data), Demo Sales Company (financial data), Demo Service Company (financial data), Demo Sales Company vs Demo Service Company variance (formula), and the variance as a percentage (formula). Row 4 shows Revenue across all columns. Cell B4 is a Financial data cell — Entity: Demo Group, Data source: KPI, KPI: Revenue, Value: Current month. Cell D4 is a Financial data cell — Entity: Demo Service Company, same parameters. Cell E4 is a Formula cell: =B4-D4. Cell F4 is a Formula cell: =IF(D4=0,0,E4/ABS(D4)) — the standard variance percentage, protected against division by zero.
The result is a board-ready management P&L that compares group and entity performance, shows absolute and percentage variances, and updates automatically every month — without any manual data entry.
Demo Report Two: Intercompany Analysis
The Intercompany Analysis cell-based report — entity-to-entity intercompany positions across sales, purchases, AR, AP, and net intercompany balance.
The Intercompany Analysis report shows the group’s intercompany positions entity by entity, counterparty by counterparty. Each row represents one entity-counterparty pair, with columns for intercompany Sales, Purchases, Accounts Receivable, Accounts Payable, and Net IC balance. The Net IC column uses a formula to compute the net intercompany position, and negative balances display in red via conditional formatting.
This report addresses one of the most common group reporting requests: a single view of where intercompany mismatches exist across the group, which entities owe what to which counterparties, and whether the net positions balance. It pulls intercompany data directly from BrizoConsol’s intercompany dataset — no manual extraction from individual entity ledgers required.
Three Ways to Export
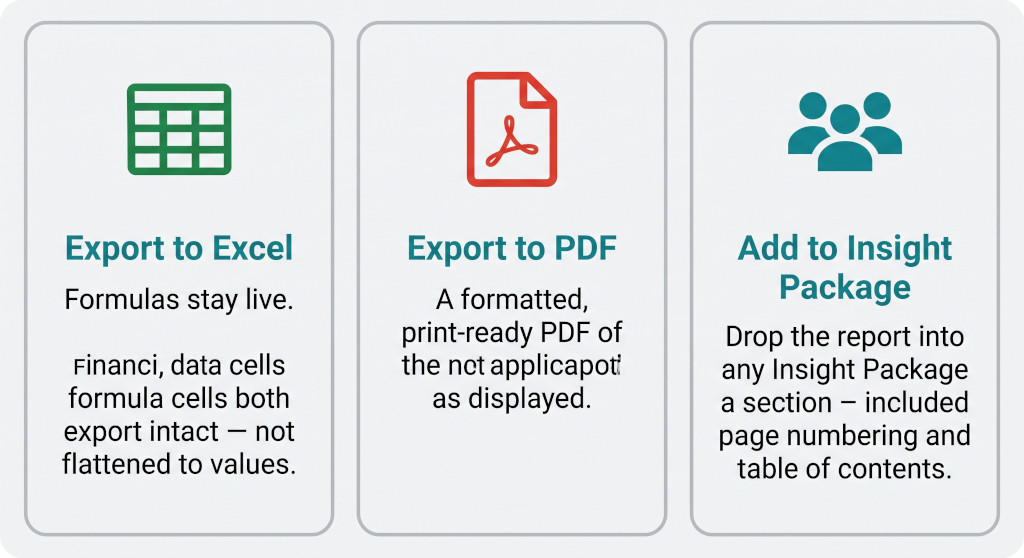
Export to Excel with live formulas, to PDF, or drop the report into an Insight Package as a section.
Cell-based reports can be exported in three ways:
Export to Excel
The report exports to Excel with formulas intact. Formula cells export as Excel formulas — not as static values. A finance team member opening the exported file can see, audit, and edit the formulas exactly as they appear in BrizoConsol.
Export to PDF
A formatted, print-ready PDF of the report as it appears on screen — suitable for board packs, investor reports, or audit files.
Add to Insight Package
Drop the report into any Insight Package as a section. It sits alongside standard BrizoConsol report sections and inserted files, included in the table of contents and page numbering.
The Excel export with live formulas is particularly significant for groups whose auditors or lenders want to see the calculation methodology behind a management report. Rather than providing a flat PDF with no visible workings, the group can share an Excel file where every formula is visible and traceable back to its inputs.
What You Can Build
Any report layout that can be expressed as a spreadsheet grid can be built in the cell-based reporter. Common use cases include: a group management P&L that matches the format the CFO has used for years; a multi-entity KPI dashboard comparing subsidiaries side by side; an intercompany reconciliation matrix; a covenant compliance report pulling specific balance sheet and P&L ratios; a budget-versus-actual variance analysis using prior period data sources; or a board pack summary page that pulls key metrics from across the consolidation into a single executive view.
Because the cell reference checkbox lets entity, period, and metric selections be driven by other cells, a single well-structured report can serve multiple periods and multiple entities without rebuilding the layout. Change the entity in one cell and the entire column updates. Change the period in one cell and the entire report refreshes.
Build the report your CFO actually wants
The cell-based reporter is available now in BrizoConsol. Connect your entities and start building — no spreadsheet maintenance, no manual data pulls. Your consolidated data, your layout. Start Free Trial