Group Sales by Product and Region, Across Entities and Currencies
The consolidated P&L tells the board that revenue grew. It doesn’t say which products drove it, or which region slowed. That breakdown usually sits in each subsidiary’s sales system, and every month someone exports it, converts the foreign entity’s figures by hand at whatever rate they have, and pastes both into one spreadsheet next to the group numbers. The rate is rarely the one the consolidation used, and the spreadsheet is out of date the moment a subsidiary sends a correction.
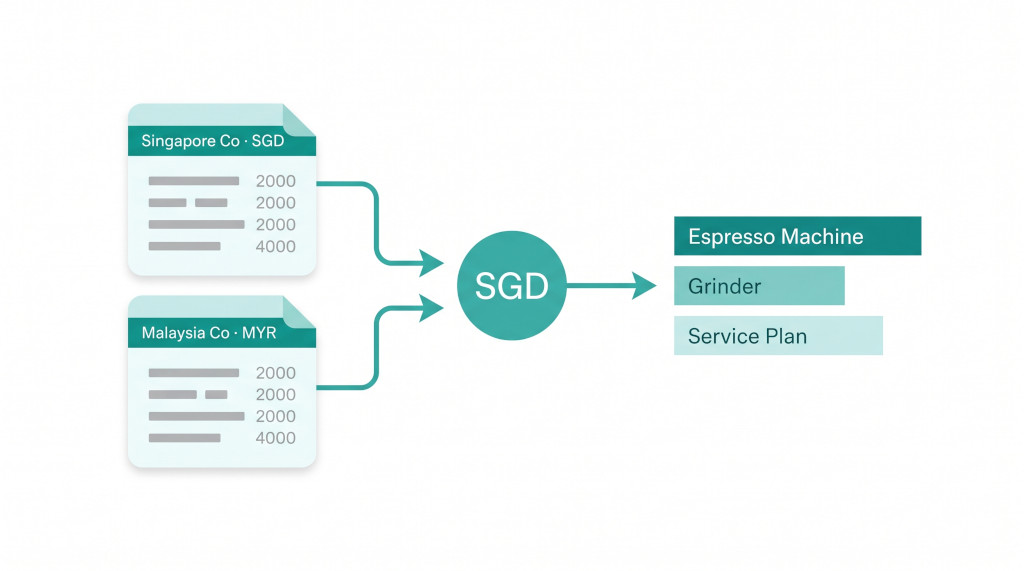
Operational Data in BrizoConsol removes that spreadsheet. Each entity uploads its own sales file in its own currency. The group reads both files as one source, translated at the same exchange rates the consolidation uses. The combined source is then available as a data source for dashboard charts, dashboard tables and custom reports.
This walkthrough uses a two-entity group: Singapore Co, which reports in SGD, and Malaysia Co, which reports in MYR. The group presents in SGD. Both entities sell the same three products — Espresso Machine, Grinder and Service Plan — in different regions.
Automate NCI calculations across all your entities.
BrizoConsol handles non-controlling interest automatically — no manual adjustments required.
How the pieces fit
An operational dataset belongs to one entity. It holds a Period (a month), a numeric Value and up to three dimensions, such as Region and Product. Each dataset also has four settings: an account, a scenario, a currency translation mode and how many dimensions it has.
When two entities each create a dataset with the same definition, a consolidated parent sees them as one source. The definition matches when these are the same:
- the dataset name;
- the dimension labels, in the same order;
- the scenario setting;
- the account setting.
When a product name appears in both entities’ files, the two entities’ values for it add into one row, after each entity’s values are translated.
Step 1 and 2: define and upload for each entity
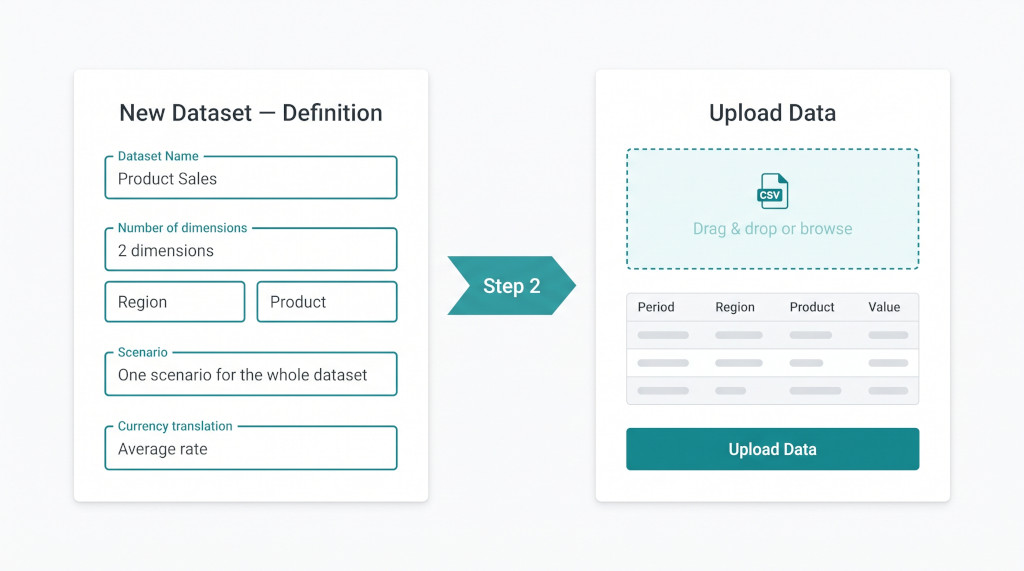
Define the dataset
Working in Singapore Co, go to Settings → Other Data → Operational Data and choose New Dataset. Step 1, New Dataset — Definition, asks for the following:
| Field | Setting for this example |
|---|---|
| Dataset Name | Product Sales |
| Number of dimensions | 2 dimensions — Dimension 1 label: Region, Dimension 2 label: Product |
| Account | One account for the whole dataset — the entity’s own sales revenue account (optional, see below) |
| Scenario | One scenario for the whole dataset — Dataset scenario: Actual |
| Currency translation | Average rate |
Currency translation decides how the dataset’s values are converted when someone views them in a different currency. There are three options:
- Average rate uses the month’s profit and loss rate, which is right for sales.
- Closing rate uses the month’s balance sheet rate.
- No translation leaves values as uploaded. Use it for measures that aren’t money, such as units sold or headcount.
Singapore Co’s own figures are already in SGD, so nothing is converted while the group presents in SGD. Setting Average rate still matters if the same dataset is ever viewed in another currency.
The Account setting is optional, but it’s useful when the file is meant to add up to revenue. With One account for the whole dataset and the entity’s sales revenue account selected, each upload’s monthly Actual totals are compared with that account’s movement in the ledger. Any month that doesn’t tie is listed with Uploaded, System and Difference columns. The upload is never blocked; the list is for review. Malaysia Co picks its own sales account. The two accounts are different records, so the grouping only requires the same account setting, not the same account.
Upload the file
Step 2, Upload Data, offers Download template. The template is built from the dimensions you defined, so its columns are Period, Region, Product and Value. Fill it in and drop the CSV into the upload area. The screen previews the first five rows and asks which column holds each field: Period Column, Value Column, Region and Product.
Singapore Co’s September file, in SGD:
| Period | Region | Product | Value |
|---|---|---|---|
| Sep-2026 | Central | Espresso Machine | 48,000 |
| Sep-2026 | Central | Grinder | 12,000 |
| Sep-2026 | East | Espresso Machine | 30,000 |
| Sep-2026 | East | Service Plan | 6,000 |
Period takes a month such as Sep-2026 or 2026-09. If you edit the file in Excel, format that column as Text so Excel doesn’t turn it into a date. Rows whose period can’t be read are skipped, and the upload reports them with their first few values.
Existing data defaults to Replace only the months in this file. With that setting, uploading October’s file adds October and leaves September as it was. Re-uploading a corrected September replaces September only. Replace all data clears the whole dataset first.
Repeat for Malaysia Co
Switch to Malaysia Co and create a dataset with the same definition: Product Sales, dimensions Region then Product, one scenario (Actual), one account for the whole dataset, and Average rate. Upload its file in MYR, the currency its books are kept in:
| Period | Region | Product | Value (MYR) |
|---|---|---|---|
| Sep-2026 | Klang Valley | Espresso Machine | 102,000 |
| Sep-2026 | Klang Valley | Grinder | 27,200 |
| Sep-2026 | Penang | Espresso Machine | 68,000 |
| Sep-2026 | Penang | Service Plan | 13,600 |
Spell the product names exactly the same way in both files. “Espresso Machine” in one file and “Espresso Machines” in the other are two different products to the group.
From the consolidated parent, the Operational Data list now shows both datasets, each labelled with the entity that owns it. The parent can open, filter, pivot and export a subsidiary’s dataset, but only the owning entity can edit it or upload to it. The dataset screen shows rows as uploaded, in the owner’s currency. Translation happens where the data is used: in dashboards and reports.
Step 3: how the currency is applied
Translation uses the group’s exchange rates: the rates on the Exchange Rates screen, quoted against the top entity’s currency, for the same month and the same scenario as the data. A value moves from the owning entity’s currency into the currency being viewed. That’s the dashboard’s display currency, or the currency selected on a report.
Each entity’s values are converted month by month before anything is added up. A year-to-date figure is therefore the sum of correctly converted months, not one year-to-date total converted at a single rate.
With an illustrative September average rate of 3.40 MYR to 1 SGD, Malaysia Co’s file converts as follows:
| Klang Valley · Espresso Machine 102,000 MYR ÷ 3.40 | 30,000 |
| Klang Valley · Grinder 27,200 MYR ÷ 3.40 | 8,000 |
| Penang · Espresso Machine 68,000 MYR ÷ 3.40 | 20,000 |
| Penang · Service Plan 13,600 MYR ÷ 3.40 | 4,000 |
| Malaysia Co September sales in SGD (210,800 MYR) | 62,000 |
Added to Singapore Co’s 96,000 SGD, the group’s September product sales are 158,000 SGD. By product, the shared names combine across both entities:
| Espresso Machine 48,000 + 30,000 (SG) + 30,000 + 20,000 (MY) | 128,000 |
| Grinder 12,000 (SG) + 8,000 (MY) | 20,000 |
| Service Plan 6,000 (SG) + 4,000 (MY) | 10,000 |
| Group product sales, Sep-2026 (SGD) | 158,000 |
Load the rates first. If the group has no rate for a currency in a given month, that month’s values are shown as uploaded — MYR sitting among SGD — and the only record of the gap is a warning in the log. Before uploading a month’s operational data, check that the month’s average rate (or closing rate) for every entity currency is on the Exchange Rates screen.
Currency translation and the Forecast and Budget scenarios aren’t included in the Standard edition. On that edition, the translation setting is visible but disabled.
See operational data on your own group
We’ll load a sales file for two of your entities and show it beside your consolidated P&L, in one currency. See It In Action
Step 4: use it in a dashboard
Every dataset becomes a data source automatically. In the dashboard editor, choose Add a card.
A chart
Set the card type to Chart and the chart type to Bar. Open Data Source; below the System sources is a group called Operational Data. From the consolidated parent, it lists each entity’s dataset by each of its dimensions, for example Product Sales (Malaysia Co) by Region. It also lists the combined source: Product Sales (Singapore Co + Malaysia Co) by Product, and the same source by Region. Pick the combined source by Product.
By default the chart shows the five largest products. Top N (Leave Blank for all) changes that number. In SGD, the September bars read 128,000, 20,000 and 10,000.
A table
Set the card type to Table and open the table type picker. The same sources appear under its Operational Data heading. Pick the combined source by Region. The default columns are Region, Value and Share %; Records and Avg Value can be ticked on. The period can be Current Month, YTD or vs Last Year. vs Budget appears only when the dataset holds Budget rows. Clicking a figure opens the uploaded rows behind it.
For September, the table lists Central 60,000, Klang Valley 38,000, East 36,000 and Penang 24,000, each with its share of 158,000.
Step 5: use it in a report
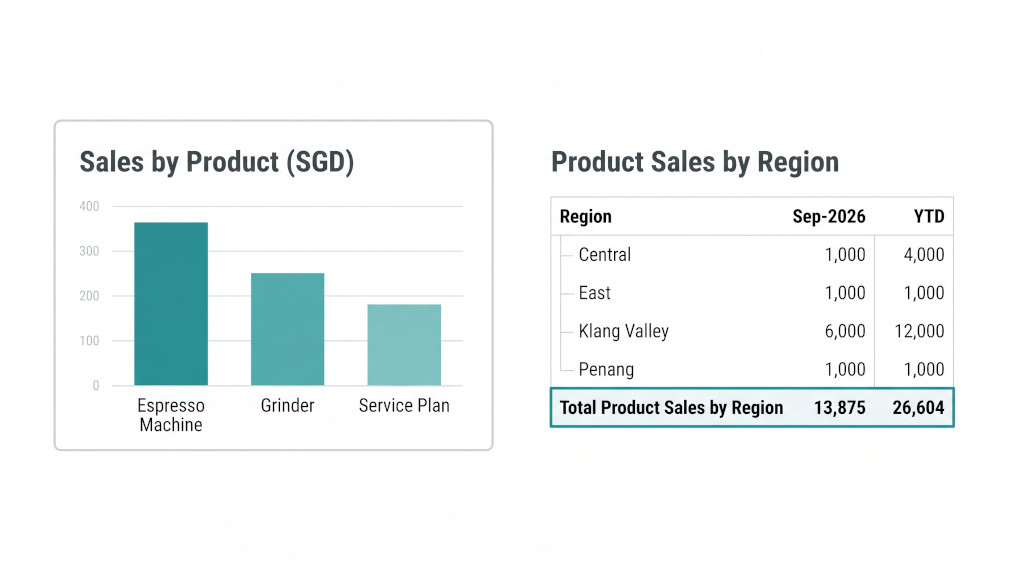
In Custom Reports, create a Row/column report or open an existing one, such as a management P&L. Add a row and set its row type to Operational Data (“Additional configured rows such as revenue by product or customer”). Choose the combined source Product Sales (Singapore Co + Malaysia Co) by Region. Under Include Region, tick the regions to show or use Select All. The row’s label defaults to the source name; here it was shortened to Product Sales by Region.
The row expands when the report runs. It shows a heading, one row per region and a Total row, across whatever columns the report already has — the month, prior months or year to date:
| Product Sales by Region | Sep-2026 |
|---|---|
| Central | 60,000 |
| East | 36,000 |
| Klang Valley | 38,000 |
| Penang | 24,000 |
| Total Product Sales by Region | 158,000 |
The figures follow the report’s own currency selection. Run the report in SGD and Malaysia Co’s regions are converted into SGD month by month before the columns and totals are added. Pick another currency the group has rates for, and the same rows come out in that currency.
For a free-form layout, a cell-based report can read the same data cell by cell. Set a cell’s type to Operational data and choose the dataset; each entity’s dataset is listed with its owner, for example Product Sales (Malaysia Co). Narrow the cell by Region or Product. The cell reads that entity’s figure in the group’s currency, so a formula can add the two entities or compare them.
Checklist: your first multi-entity operational dataset
- On the Exchange Rates screen, confirm the group has an average rate for each month you’ll upload, for every entity currency.
- In the first entity, go to Settings → Other Data → Operational Data → New Dataset. Set a name, dimension labels in order, scenario, account setting and Average rate.
- Download the template, fill it in with the Period column formatted as text, and upload it with Replace only the months in this file.
- If you chose an account, review any months listed as not tying to the ledger.
- In the second entity, create a dataset with the same name, the same dimension labels in the same order, and the same scenario and account settings. Upload its file in its own currency.
- From the consolidated parent, confirm both datasets appear in the Operational Data list, each labelled with its owner.
- Add a dashboard chart or table on the combined source, Product Sales (Singapore Co + Malaysia Co) by …, and check that the total equals the two entities’ totals after translation.
- Add an Operational Data row to a row/column report, run it in the group currency, and tie its total to the dashboard figure for the same month.
Bring your sales breakdown into the consolidation
Start a free trial and upload your first operational dataset today. Start Free Trial