How to Build a Group Working Capital Dashboard That Shows Cash Conversion Across Every Entity in Real Time
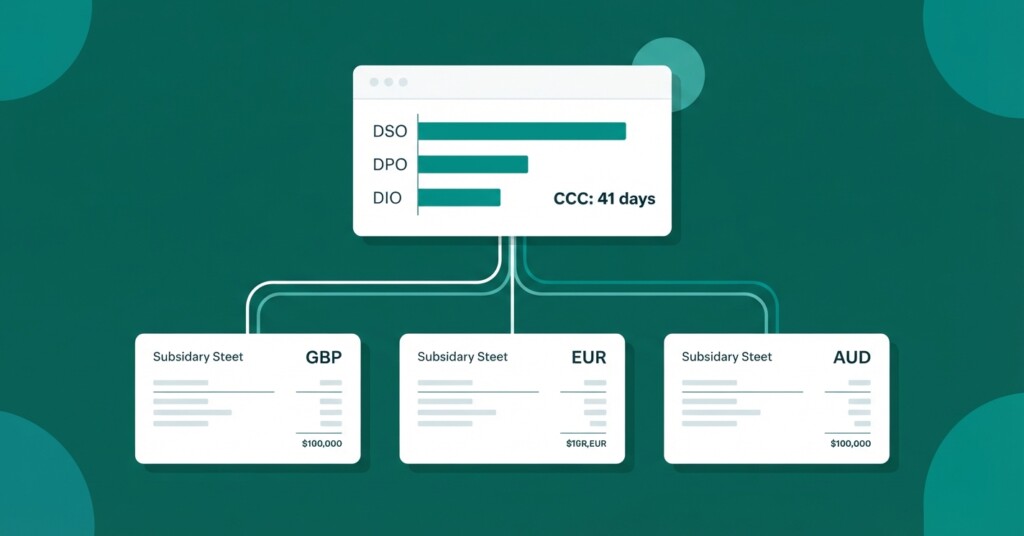
For finance teams managing multiple entities, working capital is one of the most important — and most poorly understood — metrics in the group. Each subsidiary has its own debtors, creditors, stock levels, and cash balances. But when these figures sit in separate accounting systems, the CFO sees nothing useful until someone manually consolidates spreadsheets at month-end. By then, the data is two weeks old and the opportunity to act has passed.
This article explains how to design a group working capital dashboard that aggregates cash conversion cycle data across every entity in real time — including the consolidation mechanics, intercompany eliminations, and FX translation adjustments that make the numbers meaningful rather than misleading.
Why Working Capital Dashboards Fail at the Group Level
Most working capital dashboards are built for a single legal entity. They pull trade receivables, trade payables, and inventory from one general ledger and calculate days sales outstanding (DSO), days payable outstanding (DPO), and days inventory outstanding (DIO). The cash conversion cycle (CCC) is then derived from those three figures. Simple enough.
Stop building consolidations in spreadsheets.
BrizoConsol automates multi-entity consolidation — setup in minutes, reports the same day.
At the group level, however, several complications arise immediately. First, intercompany balances inflate both debtors and creditors. If your UK holding company has sold goods to your German subsidiary on 60-day terms, that receivable appears in the UK books and the corresponding payable appears in Germany. If you simply add up the two entities, you are double-counting a balance that does not represent external working capital at all. Second, if some entities report in euros, some in US dollars, and some in Australian dollars, adding raw local-currency balances produces a figure that is arithmetically meaningless. Third, minority-owned subsidiaries introduce non-controlling interest (NCI) considerations — you may own 70% of a subsidiary but consolidate 100% of its working capital, which overstates the group’s economic interest in those assets.
Never build a group working capital dashboard by simply summing raw local-currency figures across entities. Without FX translation and intercompany eliminations, the resulting numbers are not just imprecise — they are structurally incorrect and will lead to poor capital allocation decisions.
Step One: Define Working Capital Components Consistently Across Every Entity
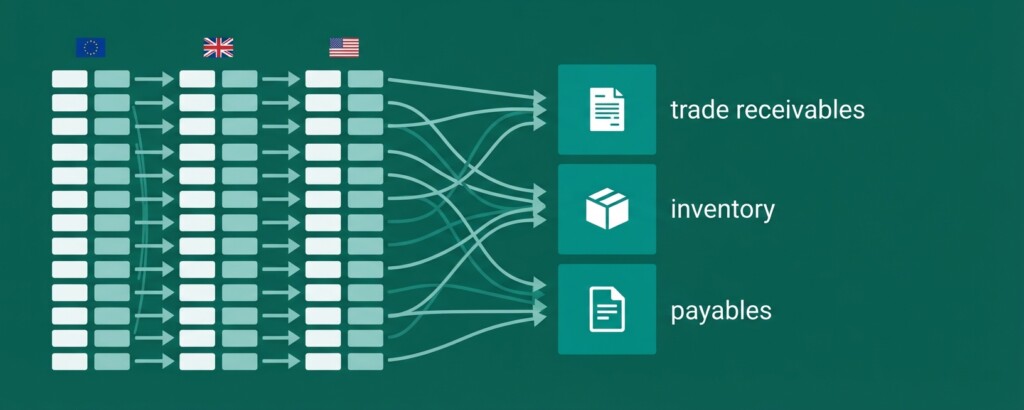
Before any consolidation logic can work, each subsidiary must map its chart of accounts to a consistent group-level account structure. This is the unglamorous foundation of any reliable group dashboard. Working capital for these purposes typically includes trade receivables (net of provisions), inventory (raw materials, WIP, and finished goods), prepayments, trade payables, accrued liabilities, and short-term deferred revenue. Each entity should tag its general ledger accounts with a group account code so that consolidation software or your data layer knows exactly which balances belong to each bucket.
Practical tip: Create a group account mapping document that shows local account codes alongside group codes. Review this mapping whenever a subsidiary changes its chart of accounts, acquires a new business, or moves to a new accounting system. Stale mappings are one of the most common causes of unexplained variances in group reports.
Step Two: Translate Every Entity Into the Group Presentation Currency
Once account mappings are in place, working capital balances from each foreign subsidiary must be translated into the group’s presentation currency. The standard approach under IFRS and most national GAAP frameworks is to translate balance sheet items — which include all working capital components — at the closing exchange rate on the reporting date.
Consider a UK group (reporting in GBP) with a subsidiary in Australia reporting in AUD. At 30 June, the AUD/GBP closing rate is 0.52. The Australian entity reports AUD 1,200,000 in trade receivables, AUD 400,000 in inventory, and AUD 850,000 in trade payables.
| AU Trade Receivables (AUD 1,200,000 × 0.52) | £624,000 |
| AU Inventory (AUD 400,000 × 0.52) | £208,000 |
| AU Trade Payables (AUD 850,000 × 0.52) | £442,000 |
| AU Net Working Capital Contribution (GBP) | £390,000 |
These translated figures feed the group dashboard. Critically, when rates move between periods, the change in translated working capital is not an operational movement — it is a translation effect. Your dashboard should ideally separate the two so that finance leaders can distinguish between a genuine improvement in DSO and one driven purely by a strengthening AUD.
Step Three: Eliminate Intercompany Working Capital Balances
This is where most ad-hoc Excel consolidations go wrong. Intercompany receivables and payables must be eliminated before any group working capital metric is calculated. Failure to do so will overstate both DSO and DPO, making the group appear to have more external debtors and creditors than it actually does.
The elimination journal is straightforward in principle. Suppose the UK parent has an intercompany receivable of £150,000 from the German subsidiary, and the German subsidiary has recorded a corresponding intercompany payable of €175,000 (translated to £150,000 at the closing rate). The consolidation elimination entry looks like this:
| Account | Dr | Cr |
|---|---|---|
| Intercompany Payables — Germany | 150,000 | |
| Intercompany Receivables — UK Parent | 150,000 |
Elimination of intercompany working capital balance: UK parent receivable against German subsidiary payable, both translated to GBP at closing rate of 1.167. Net effect on group working capital is nil.
Where intercompany balances do not agree after translation — a common situation when the two entities record the transaction in different currencies — you will have an exchange difference on elimination. Under IAS 21 (paragraph 45) and US GAAP, exchange differences on short-term intragroup trading balances must be recognised in profit or loss, not in the foreign currency translation reserve (FCTR) in equity (which is reserved for translating net assets and net investments in foreign operations). However, these exchange differences should be properly classified as foreign exchange gains or losses rather than mixed into trading revenue or cost of sales, where they would distort operating margins and working capital turnover ratios.
Step Four: Calculate Group-Level Cash Conversion Metrics
Once balances are translated and intercompany eliminations are applied, you can calculate meaningful group-level working capital metrics. The standard formulas apply, but should be calculated using consolidated figures only — not an unweighted average or sum of entity-level ratios, which ignores relative entity size and currency effects.
| Metric | Formula | Group Figure (Example) | Target Range |
|---|---|---|---|
| Days Sales Outstanding (DSO) | Trade Receivables ÷ (Revenue ÷ 365) | 47 days | 30–45 days |
| Days Inventory Outstanding (DIO) | Inventory ÷ (COGS ÷ 365) | 32 days | 25–40 days |
| Days Payable Outstanding (DPO) | Trade Payables ÷ (COGS ÷ 365) | 38 days | 35–50 days |
| Cash Conversion Cycle (CCC) | DSO + DIO − DPO | 41 days | <45 days |
| Net Working Capital | Current Assets − Current Liabilities | £2.4 million | Positive |
The CCC tells you how many days of cash are tied up in the operating cycle. A CCC of 41 days means that, on average, the group converts a pound spent on inputs into a pound received from customers in 41 days. Reducing this by even a week across a £10 million revenue group can release meaningful cash that would otherwise require a bank facility.
Step Five: Build Entity-Level Drill-Down Into the Dashboard
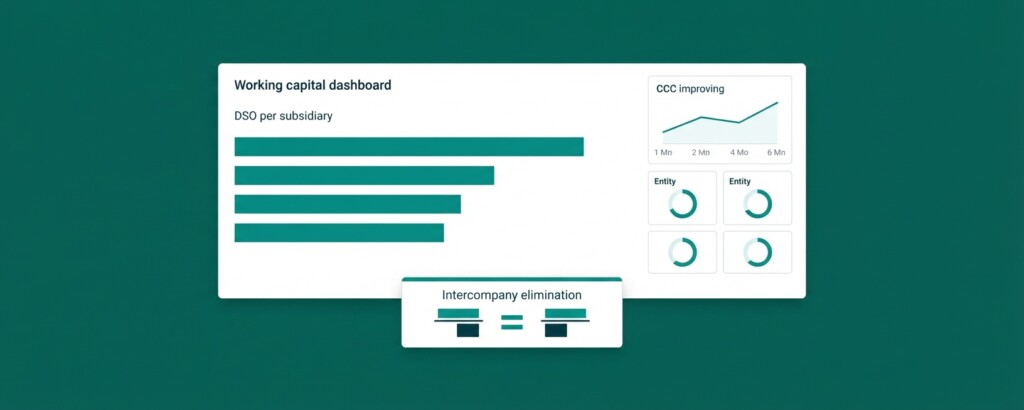
A group CCC of 41 days is useful context, but it does not tell you where the problem is. The real value of a group working capital dashboard comes from the ability to drill down to entity level and compare performance across subsidiaries. Perhaps the UK entity runs a DSO of 38 days while the Spanish subsidiary is at 72 days. That is the actionable insight — and it requires that all entity data be held in a common data model with consistent account mappings and exchange rate translation already applied.
- Display group-level CCC prominently as the headline metric, with a trend line for the prior 12 months.
- Show an entity comparison table ranked by CCC, from highest (worst) to lowest (best), so problem entities are immediately visible.
- Include an intercompany elimination summary so users can verify that cross-entity balances have been properly removed from the figures.
- Show the FX translation effect separately alongside the operational movement in working capital for each foreign subsidiary.
- Flag entities where trade receivables or payables have moved more than 15% from the prior period, prompting investigation before month-end sign-off.
- Allow the group CFO or controller to filter by region, currency zone, or entity type (trading subsidiary, holding company, dormant entity).
Handling Non-Controlling Interests in Working Capital Reporting
Where the group owns less than 100% of a subsidiary, consolidated accounts include 100% of that subsidiary’s assets and liabilities, with the NCI share disclosed separately in equity. For working capital dashboards, this means the full working capital of a partially-owned subsidiary is included in your group CCC calculation — even the portion owned by minority shareholders.
This is technically correct from a consolidation standpoint (the group controls those assets and liabilities), but it can be misleading for capital allocation decisions. For management reporting purposes, some finance teams choose to produce a ‘proportional’ working capital view that scales each subsidiary’s contribution by the group’s ownership percentage. Both views are useful; the key is to label them clearly and not mix them in the same report.
If a subsidiary is 60% owned and has a particularly poor CCC, the group’s leverage to improve it depends heavily on the shareholder agreement and management control. Working capital dashboards should indicate ownership percentage alongside entity metrics so that readers understand the practical ability to intervene.
Connecting the Dashboard to Live Accounting Data
The gap between a working capital dashboard that refreshes once a month and one that updates daily — or in real time — is almost entirely a data connectivity problem, not a calculation problem. The formulas do not change. What changes is whether the underlying trade receivables, payables, and inventory figures are pulled from the general ledger automatically or entered manually into a spreadsheet by someone on the finance team.
Multi-entity accounting platforms and consolidation tools that connect directly to subsidiary accounting systems — whether through native integrations or API connections — can pull trial balance data, apply exchange rate translation using published rates, execute intercompany elimination rules, and update group working capital figures without manual intervention. This does not eliminate the need for human review and judgement, but it removes the data-gathering and reconciliation work that currently consumes most of a finance team’s time around month-end.
For groups still running the consolidation in Excel, the practical path to a live dashboard typically involves: first, standardising account mappings across all entities; second, establishing a single source of truth for FX rates; third, documenting all intercompany elimination rules; and finally, migrating those rules into a consolidation tool that can execute them automatically. Attempting to build the dashboard before fixing the data foundation will result in a visually impressive report that no one trusts.
A working capital dashboard that shows real-time data but has not properly eliminated intercompany balances will show distorted CCC and working capital metrics. Finance teams sometimes interpret this as a genuine operational problem and initiate collection or payment programmes that are actually unnecessary. Always confirm elimination logic before communicating group metrics to the board.
Making the Dashboard Part of Your Financial Close Process
The working capital dashboard should not be something that is only reviewed after the books are closed. It is most useful as a tool during the close process itself — helping controllers identify anomalies in subsidiary balances before they are locked, flagging intercompany mismatches that need resolution, and giving the CFO enough visibility to escalate issues with subsidiary finance teams while there is still time to correct them.
Integrating working capital review into the close calendar means scheduling a dashboard review at day 3 or 4 of close, after subsidiary trial balances are submitted but before group eliminations are finalised. Any entity showing a DSO spike or an unusual intercompany balance should be investigated at this point. This discipline moves the conversation from ‘why did the numbers look odd last month?’ to ‘let us fix this before we close the period.’
Groups that operate this way consistently report shorter financial close cycles and fewer post-close restatements. The investment is in process discipline and data infrastructure — two things that are entirely within the control of the finance function, regardless of the size or complexity of the group.
See Group Working Capital Reporting in Practice
BrizoConsol is built for multi-entity finance teams that need consolidated working capital dashboards with intercompany eliminations and FX translation handled automatically. Connect your entities and see your group CCC in one view.