How to Trace a Consolidated Gross Margin Variance Back to a Single Entity, Cost Line, and Transaction
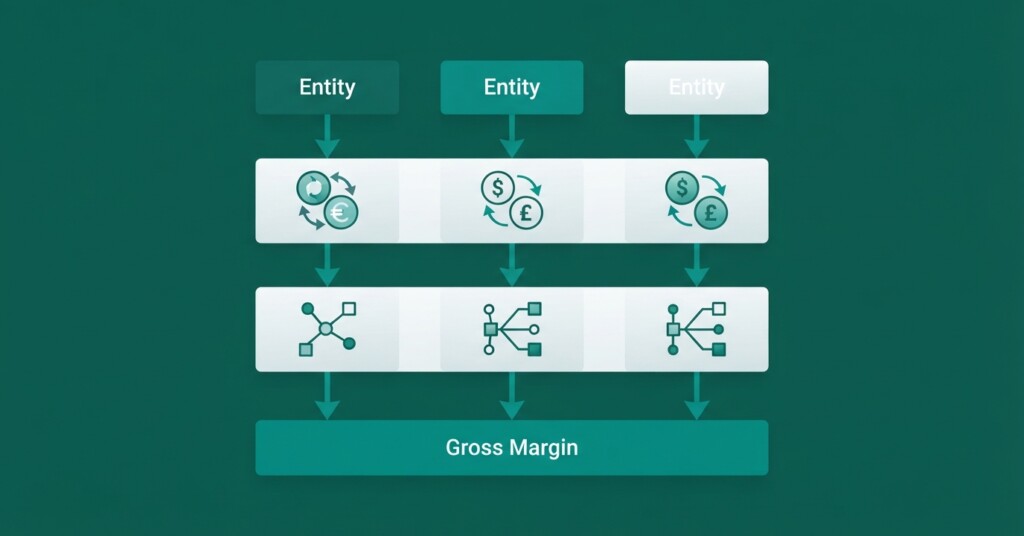
A consolidated gross margin that misses budget by three percentage points sounds like a group-level problem. In reality, it almost always originates in one entity, one cost category, and — if you dig far enough — one or two transactions. The difficulty for multi-entity finance teams is that the consolidation process compresses individual entity data into a single set of numbers, making variances feel abstract and hard to attribute. This article walks through a structured method for unpacking a consolidated gross margin variance all the way back to the root transaction, covering the intercompany eliminations, FX translation adjustments, and entity-level cost detail you need to examine along the way.
Why Consolidated Gross Margin Variances Are Hard to Diagnose
When you consolidate revenue and cost of goods sold (COGS) across five or ten entities, several mechanical processes reshape the numbers before they reach the group P&L. Intercompany sales are eliminated, so revenue that one subsidiary recognises from selling to another disappears entirely. Foreign currency revenue and expense balances are translated at transaction or average exchange rates for the period. Crucially, 100% of each controlled subsidiary’s revenue and COGS is consolidated line by line, meaning non-controlling interest (NCI) does not reduce gross profit. Each of these steps must be properly understood to avoid confusing mechanical reporting effects with operational performance.
The practical consequence is that a finance manager looking at a consolidated gross margin variance of, say, £1.2 million unfavourable cannot simply look at the entity trial balances in isolation. They need to work backwards through the consolidation adjustments in a logical sequence. Skipping steps — or relying on a single Excel workbook where eliminations and translations are tangled together — usually means the root cause takes days or weeks to surface, long after the month-end window has closed.
Stop building consolidations in spreadsheets.
BrizoConsol automates multi-entity consolidation — setup in minutes, reports the same day.
Step One — Quantify the Variance at the Consolidated Level
Before you trace anything, make sure you are measuring the variance correctly. Gross margin variance has two components: a revenue mix or volume effect, and a cost efficiency effect. Separating them matters because they point to different investigations. If consolidated revenue was on budget but COGS was over-budget, the problem is almost certainly in cost lines. If revenue was below budget and margin collapsed, you may be dealing with a pricing or volume issue that is masking an otherwise acceptable cost performance.
| Consolidated Actual Gross Profit | £8,340,000 |
| Consolidated Budgeted Gross Profit | £9,540,000 |
| Total Gross Margin Variance (Unfavourable) | –£1,200,000 |
With the total variance quantified, the next step is to isolate how much of it is a revenue miss versus a COGS overrun. In this example, suppose consolidated revenue was £500,000 below budget and COGS was £700,000 above budget. That split tells you immediately that cost control is the bigger problem and should get the first pass of attention.
Step Two — Remove Consolidation Adjustments to See Entity-Level Impact
Before attributing any variance to a specific entity, you must strip out the adjustments that are artefacts of the consolidation process itself. In gross margin analysis, these fall into two primary categories: intercompany eliminations and FX translation movements.
Intercompany eliminations and FX translation differences are group-level mechanics. They can amplify or mask entity-level variances. Always separate them from operating performance before attributing a variance to a business unit (noting that NCI is allocated only at the net profit level and does not affect gross margin).
For intercompany eliminations, check whether any intra-group sales or cost recharges were eliminated that affected COGS. A common scenario: a manufacturing entity sells goods to a distribution subsidiary at an internal transfer price. The intercompany profit on goods still held in inventory by the distribution entity is eliminated. If inventory levels at the distribution entity rose unexpectedly during the month, more intercompany profit will have been eliminated, reducing consolidated gross profit even though neither entity’s standalone performance changed meaningfully.
| Account | Dr | Cr |
|---|---|---|
| Intercompany Revenue (Manufacturing Entity) | 420,000 | |
| Intercompany COGS (Distribution Entity) | 420,000 |
Elimination of intra-group sale of goods from manufacturing entity to distribution entity — revenue and matching COGS removed on consolidation.
| Account | Dr | Cr |
|---|---|---|
| Cost of Goods Sold (COGS) | 84,000 | |
| Inventory (Distribution Entity) | 84,000 |
Elimination of unrealised intercompany profit on goods remaining in distribution entity inventory at period end (20% margin on £420,000 intra-group sale) — debited to consolidated COGS to adjust current-period profit.
After accounting for intercompany eliminations, examine FX translation. If an entity operates in a foreign currency, its P&L is typically translated at the average exchange rate for the period. If the actual average rate moved against budget, every cost line will show a translation-driven variance that has nothing to do with operational performance. Isolate this by comparing the entity’s local-currency gross margin to budget in local currency first, then separately quantify the translation impact.
| Entity | Local Currency GM (Actual) | Local Currency GM (Budget) | Local Variance | FX Translation Impact (GBP) | Operational Variance (GBP) |
|---|---|---|---|---|---|
| Entity A — UK | £3,100,000 | £3,400,000 | –£300,000 | £0 | –£300,000 |
| Entity B — Germany | €2,800,000 | €2,900,000 | –€100,000 | –£95,000 | –£85,000 |
| Entity C — US | $4,200,000 | $4,000,000 | +$200,000 | –£180,000 | +£155,000 |
| Intercompany Eliminations | n/a | n/a | n/a | £0 | –£695,000 |
| Group Total | –£275,000 | –£925,000 |
In this simplified example, Entity A is clearly the largest operational problem. Entity C actually beat its local-currency budget but FX worked against it. The intercompany elimination row reflects the unrealised profit elimination discussed earlier. Once these layers are separated, the consolidated variance of £1.2 million starts to decompose into accountable, entity-specific amounts.
Step Three — Drill Into the Underperforming Entity’s Cost Lines
With Entity A identified as the primary operational source of the variance (–£300,000 in local currency), the next step is to open its cost of goods sold detail and compare actuals to budget line by line. This is where multi-entity finance teams often hit a wall: if the consolidation system only carries top-level cost codes through to the group report, there is no detailed cost breakdown available at the consolidated level. You have to go back to the entity’s own chart of accounts.
Suppose Entity A’s COGS is structured across four cost lines: direct materials, direct labour, subcontractors, and freight inbound. A line-by-line comparison reveals:
- Direct materials: £20,000 favourable — supplier discounts achieved
- Direct labour: £15,000 favourable — headcount was below plan
- Subcontractors: £310,000 adverse — significantly over budget
- Freight inbound: £25,000 adverse — moderate overspend
The subcontractor line is clearly driving the variance. The next question is whether this is a pricing issue (subcontractor rates increased), a volume issue (more subcontractor hours were used than planned), or a misallocation (costs posted to the wrong account). Each requires a different response, and the only way to answer it is to look at the underlying transactions.
Step Four — Trace to the Individual Transaction
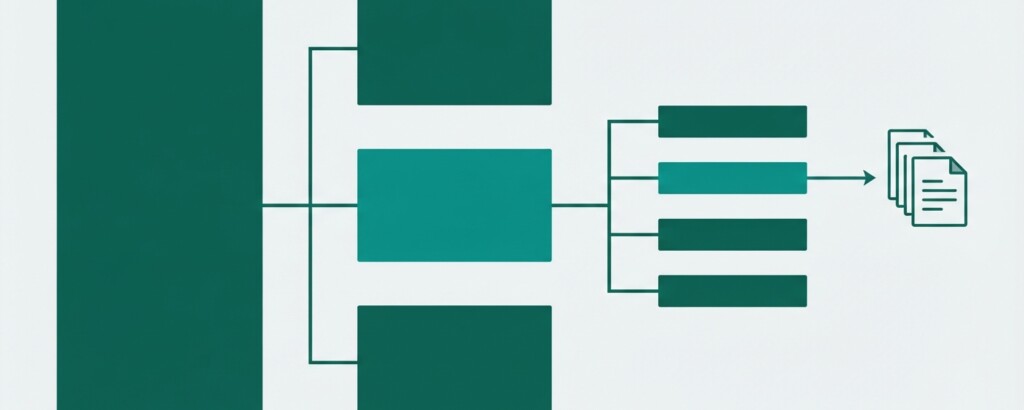
At the transaction level, you are looking at individual purchase invoices, journals, or accruals that have been posted to the subcontractor cost account. In this case, the investigation might reveal that three invoices totalling £295,000 were received from an external subcontractor who was brought in to cover a production surge in the second week of the month. A fourth journal of £15,000 represents an accrual for work completed but not yet invoiced.
This is the root cause: an unplanned production event at Entity A required external subcontractor support that was not in the budget. The consolidated gross margin variance of £1.2 million — which looked like a systemic group problem when it first appeared in the board pack — is primarily explained by three supplier invoices in a single entity, on a single cost line, arising from a single operational decision. The FX and intercompany components are secondary and mechanical rather than operational failures.
If your consolidation model only stores summarised trial balance data and discards transaction-level detail, you will always need to break out of the consolidation file and investigate in source systems when tracing variances. This gap is one of the most significant limitations of purely spreadsheet-based consolidation approaches, and it materially increases the time needed to close a variance investigation.
Step Five — Reconstruct the Full Variance Bridge
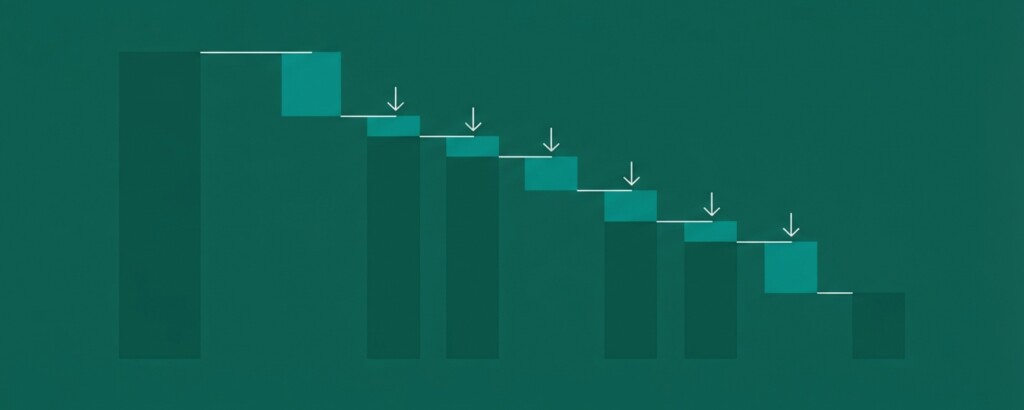
Once the root cause is identified, the finance team should reconstruct a complete variance bridge that management can follow from the consolidated headline number back to the source. A clear bridge serves two purposes: it satisfies auditor and board queries, and it makes the fix — whether that is a budget reforecast, a cost control action, or a one-off disclosure note — easier to communicate and implement.
| Budgeted Consolidated Gross Profit | £9,540,000 |
| Entity A — Unplanned subcontractor cost (operational) | –£310,000 |
| Entity A — Other COGS movements (net) | +£10,000 |
| Entity B — Operational underperformance | –£85,000 |
| Entity C — Operational outperformance | +£155,000 |
| FX Translation Impact (net across entities) | –£275,000 |
| Intercompany Elimination — Unrealised profit | –£695,000 |
| Actual Consolidated Gross Profit | £8,340,000 |
Building a Process That Makes This Faster
The investigation described above is entirely logical, but in practice it can take days when consolidation data lives in disconnected Excel files, entity trial balances are exported manually, and FX rates are applied in separate tabs that nobody else knows how to navigate. The month-end close pressure makes it worse: by the time the variance is properly attributed, the board pack has already been issued and the narrative is built around guesswork.
Finance teams that have reduced this investigation time meaningfully tend to share a few common practices. First, they maintain a consistent chart of accounts across all entities so that COGS cost lines are directly comparable without manual mapping. Second, they store FX rates centrally and apply them consistently, so the translation impact can be calculated mechanically rather than rediscovered each month. Third, they retain entity-level detail within the consolidation model — not just the summarised trial balance — so that drilling from a group number to an entity cost line does not require opening a separate system.
Automated consolidation tools that maintain a connected ledger across entities — where intercompany balances are matched and eliminated systematically, FX translation is applied from a central rate table, and NCI percentages are held as standing data — can reduce the mechanical work of variance investigation significantly. The investigative thinking still requires a skilled finance professional; what automation removes is the spreadsheet archaeology.
A Note on NCI and Its Effect on Margin Attribution
For groups with partially owned subsidiaries, it is vital to remember how accounting standards treat non-controlling interest. Under both IFRS 10 and US GAAP, 100% of a controlled subsidiary’s revenue and COGS is consolidated line by line into the group P&L. NCI is only allocated at the foot of the income statement across net profit and comprehensive income. Consequently, a subsidiary’s gross margin variance flows into consolidated gross profit at 100%, not prorated by ownership percentage. When reconciling gross profit variances back to entity management accounts, finance teams must not apply an NCI haircut to gross margin, or the variance bridge will fail to reconcile.
Summary: The Five-Step Variance Trace
- Quantify the consolidated gross margin variance and split it between revenue miss and COGS overrun.
- Strip out intercompany eliminations and FX translation differences to isolate operational variances by entity (recognising that NCI does not prorate consolidated gross profit).
- Drill into the underperforming entity’s COGS cost lines to find the specific category driving the overrun.
- Go to transaction level — purchase invoices, journals, accruals — to identify the root-cause events.
- Reconstruct a complete variance bridge from consolidated headline to source transaction, and use it for management reporting and action planning.
Gross margin variances are rarely as mysterious as they first appear in a consolidated report. The challenge is having the data architecture and process discipline to work through the consolidation layers quickly. Finance teams that invest in connected, entity-level data — whether through disciplined Excel discipline or purpose-built consolidation tooling — consistently close variance investigations faster and report with more confidence.
See How Connected Consolidation Data Speeds Up Variance Analysis
BrizoConsol is built for multi-entity finance teams who need to move from consolidated headline numbers to entity-level and transaction-level detail without rebuilding their workbooks every month.