Revenue per Employee Across a Group: Headcount, Custom KPIs and a People Dashboard
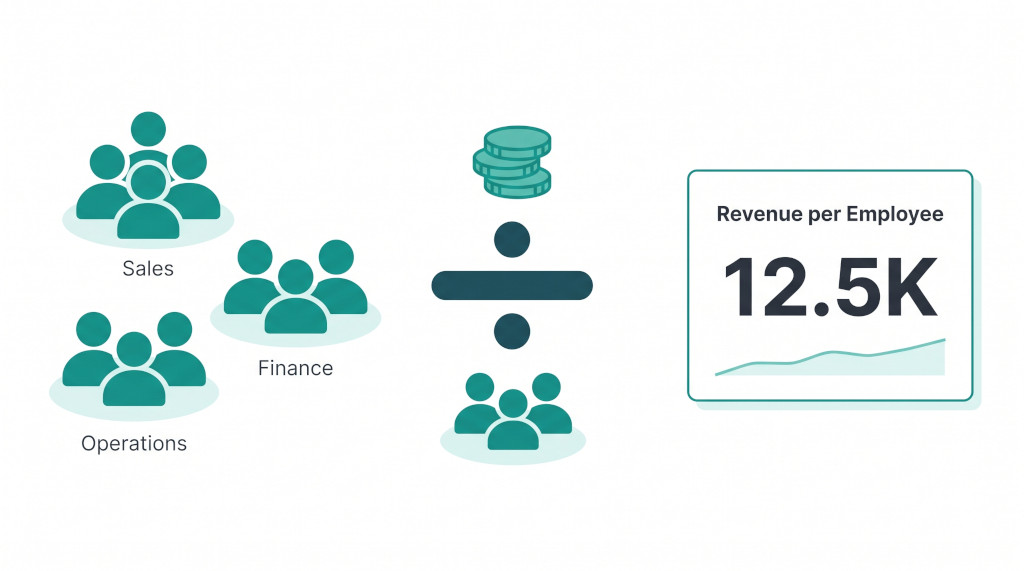
Boards ask a simple question once a group reaches a certain size: are we getting more productive as we hire? The ledger holds half the answer — revenue and staff costs, consolidated and in one currency. The other half, how many people the group employs, sits in each subsidiary’s HR system. So the per-employee ratio ends up being calculated in a spreadsheet, using last month’s headcount and this month’s revenue, and nobody is quite sure which month it is.
BrizoConsol puts both halves in one formula. Each entity uploads its monthly headcount as operational data. A custom KPI divides a ledger figure by that headcount. A dashboard card shows the result for the current month or the year to date, with a trend line.
This walkthrough uses a two-entity group: Singapore Co and Malaysia Co. The group presents in SGD. It builds two KPIs, Revenue per Employee and Staff Cost per Employee, then a dashboard around them.
Stop building consolidations in spreadsheets.
BrizoConsol automates multi-entity consolidation — setup in minutes, reports the same day.
Step 1: upload headcount for each entity
Working in Singapore Co, go to Settings → Organisation Settings → Operational Data and choose New Dataset. Headcount needs fewer settings than a sales file:
| Field | Setting | Why |
|---|---|---|
| Dataset Name | Headcount | Malaysia Co uses the same name, so the group can read both as one source on the dashboard |
| Number of dimensions | 1 dimension — Dimension 1 label: Department | Lets the dashboard break headcount down by department |
| Account | No account | Headcount isn’t posted to any ledger account |
| Scenario | One scenario for the whole dataset — Actual | See the note on budgets below |
| Currency translation | No translation | Headcount isn’t money. Values are read exactly as uploaded, whatever currency the reader is viewing in |
Download the template (columns Period, Department, Value), fill in one row per department per month, and upload it. Each value is the number of people at the end of that month:
| Period | Department | Value |
|---|---|---|
| Sep-2026 | Sales | 16 |
| Sep-2026 | Operations | 26 |
| Sep-2026 | Finance | 6 |
Then switch to Malaysia Co and create a dataset with the same definition. Its September file reads Sales 20, Operations 28, Finance 4. At the group level, September headcount is 100: 48 in Singapore and 52 in Malaysia.
Keep Existing data on Replace only the months in this file. Each month you upload one month’s file; earlier months stay in place, and the KPI’s trend line reads them.
If you also plan headcount, set the scenario to Scenario column in the uploaded file and upload Actual and Budget rows in one file. The KPI below then reads budget headcount when a card is set to compare against budget. Forecast and Budget aren’t available on the Standard edition.
Step 2: build the KPIs
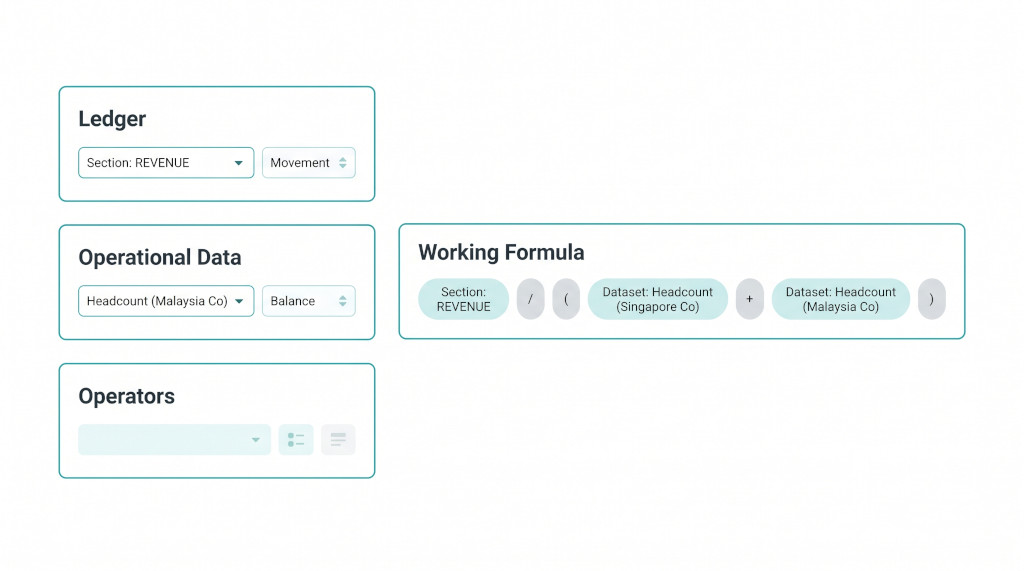
Custom KPIs are defined once, at the group, and are available on its dashboards and reports. Go to Settings → Global Settings → Reporting → Custom KPI and choose Add a new KPI. The custom KPI builder is included from the Pro edition.
The builder has a palette on the left and a Working Formula on the right. The palette offers:
- Ledger: a section or account from the trial balance;
- Operational Data: a dataset you uploaded, optionally narrowed by its dimensions;
- Fixed Value: a constant;
- Period: Add days in period and Add months elapsed;
- Operators: + − ÷ × and brackets.
Every ledger and dataset row is added with a basis, either Movement or Balance.
Revenue per Employee
Enter the KPI Name Revenue per Employee and leave Is Percentage unticked. Then build the formula:
- Ledger → Section: REVENUE, basis Movement → Add.
- Operator /, then (.
- Operational Data → Headcount (Singapore Co), leave Department on All, basis Balance → Add.
- Operator +.
- Operational Data → Headcount (Malaysia Co), All, basis Balance → Add.
- Operator ), then Add KPI.
The Result line reads 'Section: REVENUE(Movement)' / ( 'Dataset: Headcount (Singapore Co)(Balance)' + 'Dataset: Headcount (Malaysia Co)(Balance)' ). The builder won’t save a formula with two values side by side, an operator at the start or end, or unmatched brackets.
Each dataset row reads one entity’s dataset, which is why the formula adds the two entities’ headcount. A dataset row can also be narrowed: pin Department to Sales and the row reads only the sales team, which gives a Revenue per Salesperson KPI.
Why the basis matters
Revenue is a flow, so it accumulates over the period. Headcount is a position: the number of people on a given date. The basis tells the KPI which way to read each row:
- Movement adds up every month in the period being evaluated. That’s one month for Current Month, and every month from the start of the fiscal year for YTD.
- Balance takes the value for the reporting month only.
With headcount on Balance, the YTD reading divides year-to-date revenue by the people employed now. If headcount were added on Movement, YTD would divide by the sum of nine monthly headcounts. That is revenue per employee-month, a different and much smaller number.
Staff Cost per Employee
Add a second KPI named Staff Cost per Employee. The ledger row is the group’s salaries account from the group chart of accounts, basis Movement, divided by the same bracketed headcount sum on Balance.
Making YTD comparable to a month
Revenue per Employee on YTD is nine months of revenue per head, which can’t be compared with a single month. To get a monthly average that works on any period, place Add months elapsed after revenue: REVENUE(Movement) / months elapsed / (headcount + headcount). Months elapsed counts the months in the period being evaluated: 1 for Current Month, 9 for a September YTD in a calendar fiscal year.
See your per-employee KPIs live
We’ll load a month of headcount for two of your entities and build the KPI on your own consolidated revenue. See It In Action
Worked example
These figures are illustrative. September 2026, fiscal year starting in January, group presenting in SGD:
| Section: REVENUE, Sep-2026 (Movement, consolidated) | 1,250,000 |
| Headcount (Singapore Co), Sep-2026 (Balance) | 48 |
| Headcount (Malaysia Co), Sep-2026 (Balance) | 52 |
| Revenue per Employee — Current Month 1,250,000 / 100 | 12,500 |
| Section: REVENUE, Jan–Sep 2026 (Movement) | 10,800,000 |
| Headcount at Sep-2026 (Balance, both entities) | 100 |
| Revenue per Employee — YTD 10,800,000 / 100 | 108,000 |
| With months elapsed 10,800,000 / 9 / 100 | 12,000 |
| Salaries account, Sep-2026 (Movement) | 420,000 |
| Staff Cost per Employee — Current Month 420,000 / 100 | 4,200 |
September’s revenue per employee, 12,500, is above the year-to-date monthly average of 12,000. That’s the trend a board wants to see, and the card’s line chart shows it month by month.
Step 3: build the dashboard
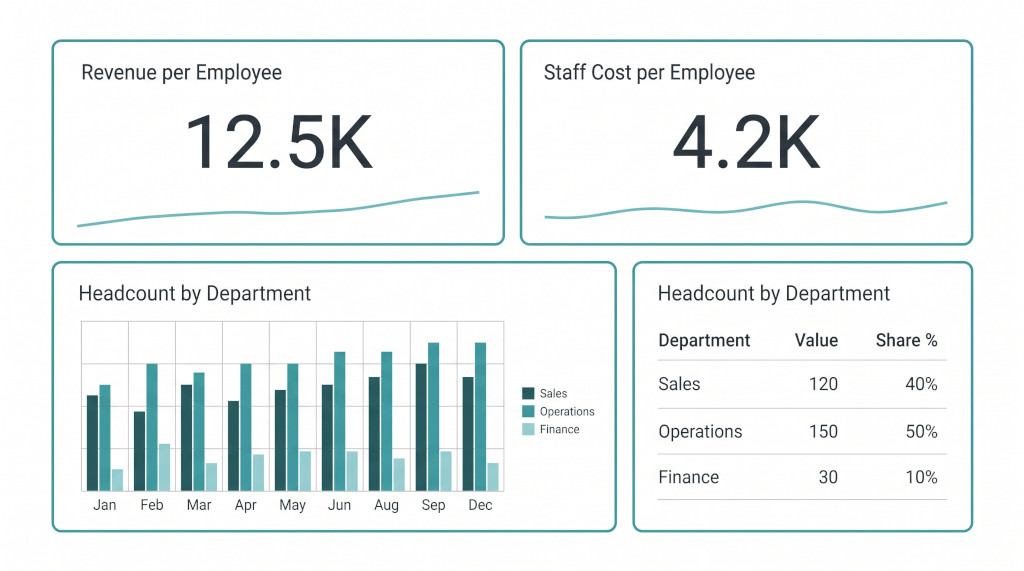
Open the group’s dashboard editor and choose Add a card for each of the following.
Two KPI cards
Set the card type to KPI Card. In the Section / KPI picker, the custom KPIs are listed under KPIs as KPI: Revenue per Employee and KPI: Staff Cost per Employee. Set Display to Number with line chart and choose the data type:
- Current Month for the latest month;
- YTD for the fiscal year to date;
- vs Last Year to compare with the same period a year earlier;
- vs Budget if budget headcount and a budget ledger are loaded.
The card shows numbers in short form, so 12,500 appears as 12.5K.
Headcount by department, as a chart
Set the card type to Chart, chart type Bar. Under Data Source, the Operational Data group lists each entity’s dataset and, because both entities used the same definition, the combined source Headcount (Singapore Co + Malaysia Co) by Department. Choose the combined source. The bars show 36 in Sales, 54 in Operations and 10 in Finance for September, and the same split for each earlier month you’ve uploaded.
Headcount by department, as a table
Set the card type to Table and pick the same combined source under the table picker’s Operational Data heading. The default columns are Department, Value and Share %. Set the period to Current Month.
Set Period Weighting to Last Period on both headcount datasets. A YTD table uses the reporting month’s headcount; quarterly and yearly charts use the quarter-ending or fiscal-year-ending month. Departments and entities are still added together within that month. If the ending month has no data, no value is shown; an older month is not carried forward. Sum remains the default for flows such as sales. Custom KPI rows keep their own Movement or Balance basis.
Beyond the dashboard
The same KPIs are available as a KPI row in a row/column custom report, so Revenue per Employee can sit under the consolidated P&L in the monthly management pack. Because the KPI is defined once at the group, every dashboard and report that uses it reads the same formula, with the same basis on every row.
Checklist
- In each entity, create an operational dataset named Headcount with dimension Department, No account, scenario Actual and No translation.
- Upload one row per department per month, using end-of-month headcount, with Replace only the months in this file.
- In Settings → Global Settings → Reporting → Custom KPI, add Revenue per Employee: Section: REVENUE on Movement, divided by both headcount datasets added together on Balance.
- Add Staff Cost per Employee the same way, with your salaries account on Movement.
- Optionally, add months elapsed for a monthly average that works on YTD.
- On the dashboard, add two KPI Cards with Number with line chart, set to Current Month or YTD.
- Add a monthly bar chart and a Current Month table on Headcount (Singapore Co + Malaysia Co) by Department.
- Check one month by hand: consolidated revenue divided by the two entities’ end-of-month headcount should equal the card.
Put people metrics beside your consolidated results
Start a free trial, upload a month of headcount and build your first custom KPI. Start Free Trial