Three Things That Just Changed in the Insight Package Editor
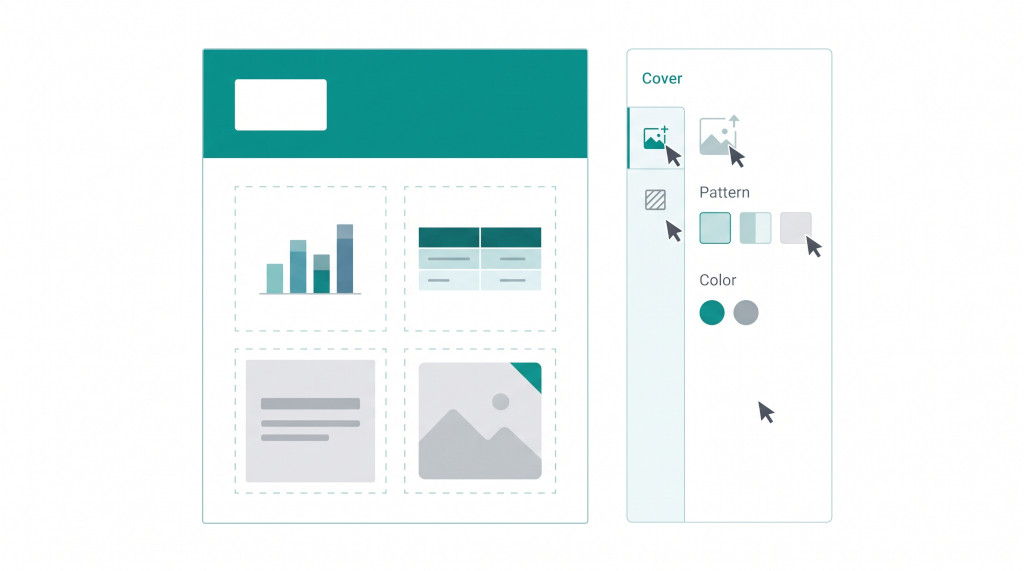
The Insight Package started as a way to produce a structured, branded report directly from the consolidation — no Excel, no copy-paste from dashboards. It worked well for teams who wanted a fixed layout: cover page, financial statements, a few commentary sections, a chart or two. But two problems kept coming up in practice.
The first was presentational. Teams needed their logo on the cover, and they needed control over the pattern and colour scheme. Those things existed as settings somewhere in the editor, but they were scattered, hard to find on first use, and the logo had to be re-added after certain actions. The cover was the first thing a reader saw and the last thing that felt properly finished.
The second was structural. Every section type in the Insight Package editor is defined in advance: a chart section holds a chart, a text section holds text, a table section holds a table. That rigidity is useful for consistency across a large pack, but it means that any page that needs a chart next to a commentary block, or a KPI figure sitting beside a map, cannot be built inside the editor at all. Finance teams were designing those pages in PowerPoint and appending them to the PDF export. This update addresses both problems directly, and adds a third capability — live financial figures that write themselves into commentary sections — that removes one more manual step from the monthly close routine.
Stop building consolidations in spreadsheets.
BrizoConsol automates multi-entity consolidation — setup in minutes, reports the same day.
A Redesigned Cover Editor
The Insight Package editor now has a dedicated Cover tab. Previously, cover-related settings appeared in different places depending on what you were configuring. The Cover tab collects them in one panel and makes the cover the starting point of any package edit, which is the order most authors actually work in.
Logo upload
Teams can now upload their logo directly to the cover inside the editor. The file is validated for file type and size before upload and is stored in the database against the package — not as a loose file that can drift out of sync during a publication or duplication. When you publish the package, duplicate it for another period, or export it to PDF, the logo follows the package without any additional action.
The logo appears in the designated cover logo zone, which sits at the top of the cover page. The position is fixed to match the standard cover template; the size scales proportionally from the uploaded file. If the package has no logo, the zone renders empty — the rest of the cover is unaffected.
Pattern and theme
The Cover tab also exposes the cover pattern selector and the colour theme selector in the same panel. Pattern controls the decorative geometric layer behind the cover heading. Theme applies a colour family to the cover that can differ from the body section colour scheme. Both settings were available before; they are now in one place rather than requiring navigation to a separate settings area.
Unsaved changes protection
If you change a cover setting and then navigate away from the editor — by clicking back to the package viewer, or opening a different section — the editor prompts you to save or discard before leaving. This brings the Cover tab into line with the rest of the editor, where unsaved section edits already trigger the same prompt.
Existing packages load without any migration step. The Cover tab appears automatically the next time you open the editor. If you had previously uploaded a logo via another route, it is carried across.
Free Canvas Pages
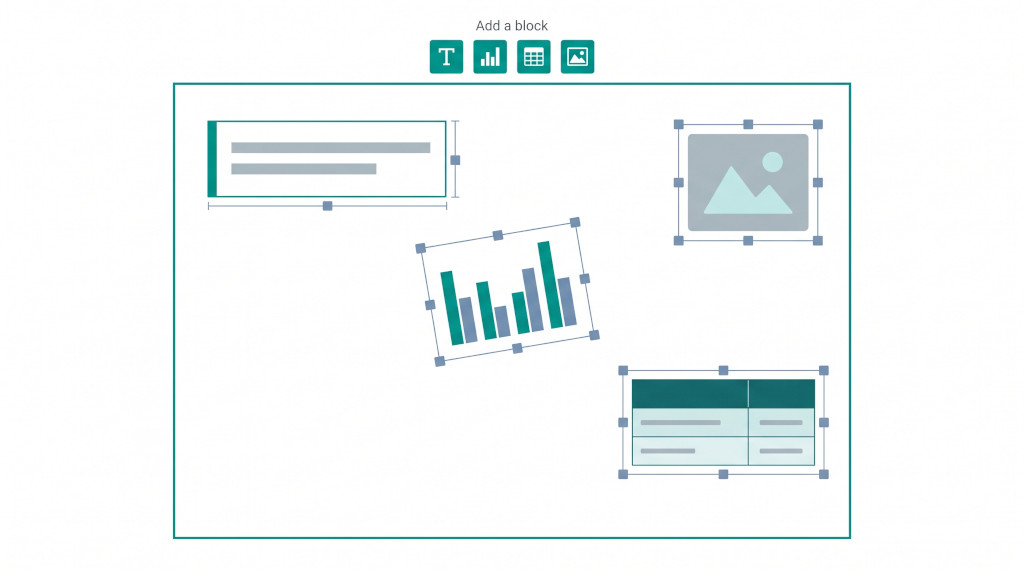
A Free Canvas is a new section type in the Insight Package editor. Unlike every other section type — which is structured around one content element — a Free Canvas page is blank. The author places any combination of blocks on it, positions each block wherever they want on the page, and sizes them by dragging the edges. The result is a page that can carry a chart beside a commentary, a table above an image, or any other arrangement that the fixed section types cannot produce.
Adding a canvas page
In the editor, open the Add a section tab. The section type list shows Free Canvas alongside the existing types. Unlike types that open a configuration dialog before inserting the section, clicking Free Canvas inserts the page immediately with an empty canvas. The dialog step is skipped because there is nothing to pre-configure — the canvas starts blank.
Block types
Once the canvas is open, the Add a block toolbar along the top of the canvas offers four block types:
- Text — a rich-text block with the same formatting toolbar as a standard text section, including financial variables (see the next section).
- Chart — a chart sourced from any of the financial data sources available to Insight Package charts, including consolidated P&L lines, balance sheet lines, and custom datasets.
- Table — an operational data table card. When a table block is first added, it defaults to the first available table source so the block renders immediately rather than appearing as an empty frame.
- Image — a picture uploaded directly to the canvas. Images are stored against the package and cannot reference images uploaded to a different package or a different group.
Positioning and sizing
Every block on the canvas has drag handles on its corners and edges. Drag the block body to reposition it; drag an edge or corner to resize it. Position and size are stored as percentages of the page width and height, so the layout renders at the same proportions in the web viewer, in the PDF export, and on any screen width. A block repositioned on a wide desktop monitor will sit in the same relative position when the package is printed on A4.
Limits
A single canvas page holds up to 40 blocks. A text block within a canvas is subject to the same character limit as a standalone text section. The save is rejected if either limit is exceeded, with a message naming which constraint was hit.
Images uploaded to a canvas are package-specific. If you duplicate a package, the canvas images are copied to the new package automatically. If you try to reference an image from a different package manually, the save will be rejected.
Live Financial Variables in Text Sections
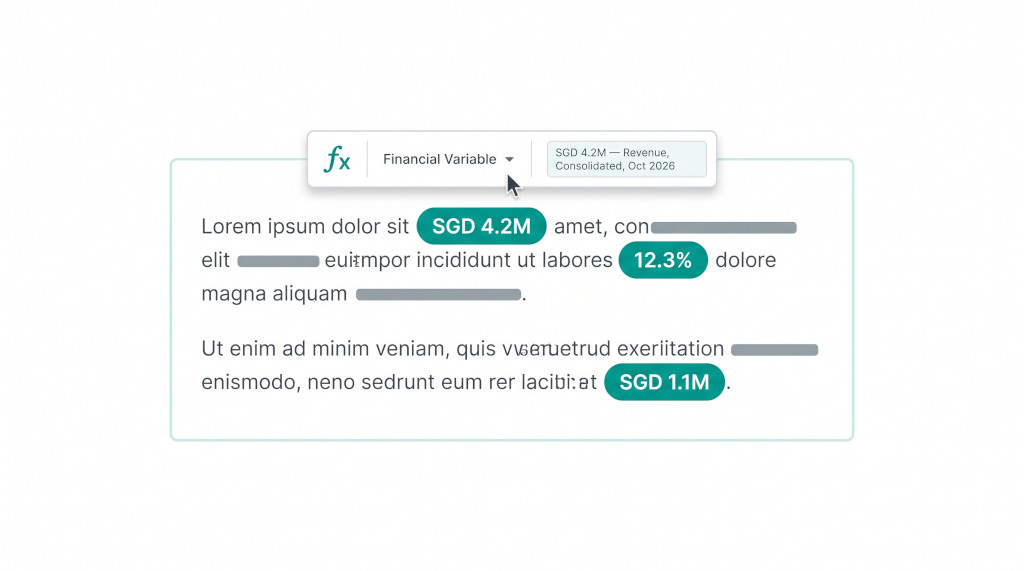
Text sections in the Insight Package — including text blocks on a Free Canvas — can now contain live financial figures. The author inserts a variable into the commentary; the figure is read from the financial data each time the package is viewed or exported, using the period the package is built for.
This replaces a manual step that most teams had baked into their month-end routine: open the package, find every number mentioned in the commentary, cross-check it against the dashboards, update it, re-export. With text variables, the numbers update themselves.
Inserting a variable
In the text section editor, a financial variable button opens a picker. The picker is the same one used to bind a Cell Report cell — you select the data type, the account or metric, the entity scope (consolidated or a specific entity), and the period. You also choose how the figure should display: decimal places, thousands separator, currency symbol, K/M/B abbreviation, brackets for negatives, or as a percentage.
Once inserted, the variable appears in the text as a small chip. The chip shows a preview of the current figure so you can check that the binding is correct before saving. The chip is not editable text — it represents the binding, not the number. When the package is viewed or printed, the chip is replaced by the resolved figure.
How variables are stored
A variable is stored inside the section’s HTML as a placeholder <span> element. The span carries a data-insight-variable attribute that holds the binding in an encoded form. No additional database column is needed. This means variables travel with the section through duplication, backup, and publication without any schema change on the package itself.
When the editor opens a section for editing, the variables are left as chips — the resolved figures are not written back into the HTML. This is intentional: saving a resolved figure would freeze the number at the value it held when the editor was last opened, which is the opposite of what the feature is for.
Period resolution
A variable that names a specific period always reads that period. A variable that does not name a period reads the month the package is built for — the period selected when the package is opened or generated. This means the same section template can be reused month after month without editing the variables; the figures change as the period changes.
What happens when a figure cannot be resolved
If a variable cannot be resolved at view time — because the underlying account has been removed, the data source is unavailable, or a mapping is broken — the chip is replaced by its configured fallback text (typically a dash or a zero), and the failure is logged. The package continues to render; a single unresolvable variable does not block the rest of the page.
Validation at save
When a text section is saved, the variables it contains are validated. A section that contains a variable with a binding that can never resolve — for instance, an account that does not exist in the group chart of accounts — is rejected before reaching the database, with a message identifying the problem variable.
See the Insight Package in action
Watch a walkthrough of the Free Canvas editor and text variables in a live consolidation environment. See It In Action
A Worked Example: Monthly Management Pack with Variables and a Canvas Page
Consider a group finance team that produces a monthly management pack covering three entities: a Singapore trading company, a UK services subsidiary, and an Australian holding company. Their standard pack includes a consolidated P&L, a balance sheet, an intercompany elimination summary, and two narrative pages — one for the executive summary and one for variance analysis.
Previously, the variance analysis page was a hybrid: a chart from BrizoConsol pasted into a Word document, then manually annotated with the actual figures, then converted to PDF. With the current update, the same page can be built entirely inside the editor.
The page is a Free Canvas section. The author adds a bar chart block at the top spanning the full width of the canvas, sourced from the consolidated revenue line, showing actuals versus budget by month for the year to date. Below it, two blocks sit side by side: on the left, a text block carrying the variance commentary; on the right, a table block showing the entity contribution breakdown.
The text block in the commentary contains three variables:
| Consolidated revenue (YTD, Oct 2026) | SGD 18.4M |
| Variance vs budget | +SGD 1.2M |
| Variance as % of budget | +7.0% |
The commentary section reads, in the editor, as:
“Consolidated revenue for the ten months to October 2026 reached SGD 18.4M, ahead of the annual budget by SGD 1.2M (+7.0%). The outperformance is concentrated in the Singapore trading entity, which contributed 68% of consolidated revenue in the period.”
When the package is viewed or exported for November, the three chips automatically resolve to the November figures without any edit to the section. The remainder of the sentence — including the 68% attribution, which was manually verified — remains as written until the author updates it. This separates the work that must be done by a person each month (qualitative judgement, entity attribution commentary) from the work that should be done by the system (transcribing numbers from the dashboards into the text).
The cover of the pack carries the group logo uploaded once into the Cover tab, the teal theme selected to match the group’s brand guidelines, and a geometric pattern on the header band. None of this changes month to month.
Getting Started: First-Time Checklist
- Open an existing Insight Package in the editor (or create a new one from the Insight Packages list).
- Click the Cover tab in the editor. Upload your group logo using the logo upload control. Select your preferred cover pattern and colour theme. Click Save.
- To add a Free Canvas page, click Add a section and select Free Canvas. The canvas inserts immediately with no dialog.
- In the canvas toolbar, click the block type you want to add first. A block appears at the top-left of the canvas; drag it to the position you want and resize by dragging the edges.
- To add a financial variable to a text section (or a text block on the canvas), place your cursor in the text where the figure should appear, then click the financial variable button in the text toolbar.
- In the variable picker, select the data type, account or metric, entity scope, and period. Choose the display format (currency, decimals, abbreviation). Click Insert. The chip appears in the text with a preview of the current figure.
- Save the section. The system validates every variable binding before saving. If a binding cannot be resolved, the save will indicate which variable needs attention.
- View the package. All variable chips resolve to live figures. Open the PDF export to verify the layout and figures render as expected at print dimensions.
Ready to build your management pack?
BrizoConsol is free to start. Set up your consolidation, build your first Insight Package, and send it to your stakeholders — all in one place. Start Free Trial