When Every Entity Hits Its KPI But the Consolidated Group Picture Is Wrong: Intercompany Distortions in Multi-Entity Reporting
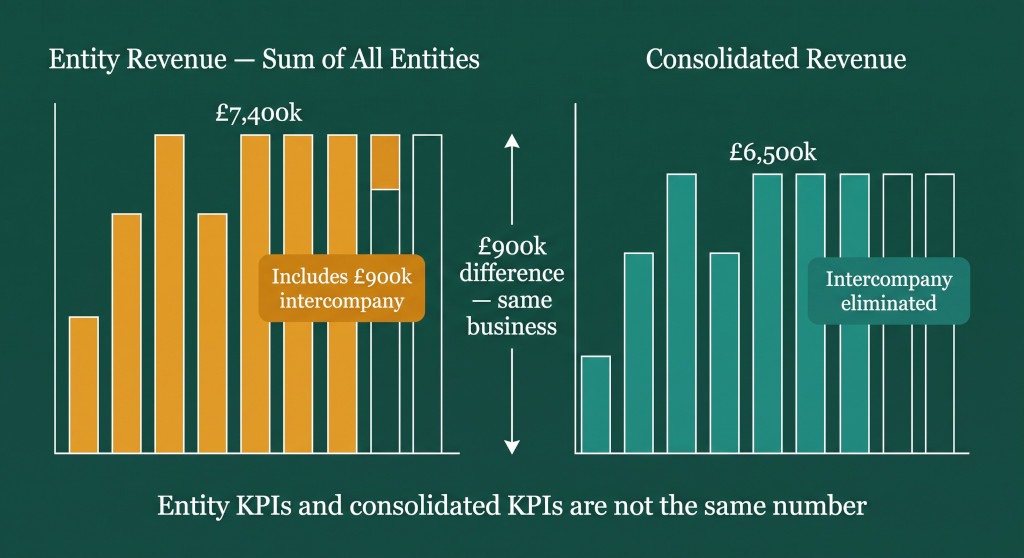
Priya is the group finance director of Sterling Consumer Group, a five-entity consumer products business with a holding company and four trading subsidiaries. Each month she receives a management pack showing revenue, EBITDA margin, and working capital metrics for each entity. Each month the entities collectively appear to be hitting their targets. And each month, the consolidated view tells a subtly different story — one that doesn’t reconcile to the sum of the entities in the way that Priya’s board expects it to.
The revenue total across entities is £7,400,000. The consolidated revenue is £6,500,000. The EBITDA margin for the holding company is 94% — apparently the highest-performing entity in the group by a wide margin. The EBITDA margin for the trading subsidiaries averages 17%, which the board questions every quarter because external benchmarks for the sector suggest 23–25% is achievable. The DSO for one trading entity is 86 days — a metric the credit control team is being pressured to improve — but the target is based on a number that includes intercompany receivables that will never be a collection problem.
None of these numbers are wrong in isolation. Each entity’s management pack has been calculated correctly from that entity’s books. The problem is that entity-level KPIs include intercompany flows — management fees, intercompany revenue, intercompany balances — that eliminate at group level but distort the entity metrics in ways that make them incomparable, misleading, and in some cases the basis for decisions that would not be made if the correct underlying numbers were visible.
Intercompany eliminations without the manual work.
BrizoConsol identifies and eliminates intercompany balances automatically at consolidation.
The Three Intercompany Distortions That Affect Group KPI Reporting
Sterling Consumer Group’s situation illustrates three specific and common intercompany distortions, each of which appears in a different part of the management pack:
- Management fee income inflates the holding company’s revenue and EBITDA, making it appear to be a high-margin profit centre when it generates no external revenue at all.
- Management fee expense depresses each trading entity’s EBITDA margin below the true operating margin the business generates, creating a persistent gap between the entity view and what the consolidated accounts show.
- Intercompany receivables inflate each entity’s accounts receivable balance, producing a DSO that overstates the time taken to collect from external customers.
In each case, a finance team that uses entity-level KPIs to manage performance is looking at numbers that contain intercompany noise. The decisions made on the basis of those numbers — cost reduction targets, working capital improvement programmes, benchmarking against industry peers — may be addressing problems that are partly or entirely artificial.
Distortion 1: Management Fee Income Makes the Holding Company Look Profitable
Sterling’s holding company charges a monthly management fee of £150,000 to each of its four trading subsidiaries, generating £600,000 per month in management fee income — £7,200,000 per year. In the entity management pack, this appears as HoldCo’s revenue. Alongside it, HoldCo’s operating costs are modest (central finance team, legal, directors): approximately £370,000 per year. The resulting EBITDA margin is approximately 95%.
HoldCo — Entity view
EBITDA margin — includes £600k/month management fee income as “revenue”
HoldCo — Consolidated view
External revenue — all income is intercompany and eliminates at consolidation
At the group level, HoldCo generates no external revenue. Its management fee income is paid by entities within the same consolidated group — it eliminates against the trading entities’ management fee expense in the consolidated P&L. The consolidated accounts contain no management fee income line and no management fee expense line. The transactions are internal and do not represent income or cost from the perspective of the group as a whole.
The entity pack shows HoldCo as the highest-margin business in the group. The consolidated accounts show it as a cost centre with zero external revenue contribution. Both statements are technically accurate from their respective perspectives. The distortion arises when the entity view is used to evaluate HoldCo’s “performance” or to draw conclusions about the profitability of the management structure — neither of which the entity EBITDA margin is capable of answering.
Common management error: Boards that review entity-level performance metrics without understanding the management fee structure will consistently misread HoldCo as a high-performer and the trading entities as underperformers. The management fee is a transfer of value within the group, not a source of external economic return. Only consolidated EBITDA reflects the group’s true operating margin.
Distortion 2: Management Fee Expense Compresses Trading Entity Margins
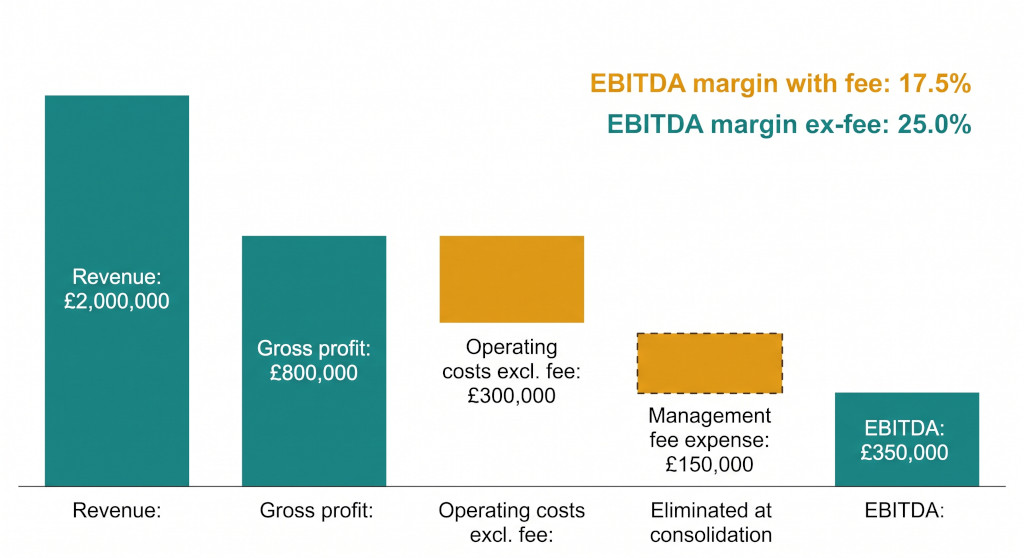
The same management fee that inflates HoldCo’s entity revenue depresses each trading entity’s EBITDA margin. Take Trading Entity A, Sterling’s largest trading subsidiary:
| Trading Entity A — annual P&L | Entity view (£) | Ex-management fee (£) |
|---|---|---|
| External revenue | 2,000,000 | 2,000,000 |
| Cost of goods sold | (1,200,000) | (1,200,000) |
| Gross profit | 800,000 | 800,000 |
| Operating costs (excl. management fee) | (300,000) | (300,000) |
| Management fee expense | (150,000) | — |
| EBITDA | 350,000 | 500,000 |
| EBITDA margin | 17.5% | 25.0% |
The 7.5 percentage point difference in EBITDA margin is entirely attributable to the management fee. The business itself — its pricing, cost efficiency, and operating leverage — generates a 25% EBITDA margin. But every entity management pack shows 17.5%, and it is the 17.5% that the board uses when benchmarking against industry peers who do not have the same internal fee structure.
The consolidated group EBITDA for the same period reflects the true picture. Across all four trading entities, the management fee income in HoldCo and the management fee expense in the trading entities cancel exactly. The consolidated EBITDA for the group reflects the genuine operating economics of all five entities combined, without the internal transfer:
| Sterling Consumer Group — consolidated P&L (simplified) | Sum of entities (£) | Eliminations (£) | Consolidated (£) |
|---|---|---|---|
| External revenue (trading entities) | 7,400,000 | — | 7,400,000 |
| Management fee income (HoldCo) | 600,000 | (600,000) | — |
| Cost of goods sold | (4,200,000) | — | (4,200,000) |
| Operating costs (excl. fee) | (1,200,000) | — | (1,200,000) |
| Management fee expense (trading entities) | (600,000) | 600,000 | — |
| HoldCo operating costs | (370,000) | — | (370,000) |
| Consolidated EBITDA | 1,630,000 | — | 1,630,000 |
| Consolidated EBITDA margin (on external revenue £7,400,000) | 22.0% |
The consolidated EBITDA margin of 22% is the number that reflects the group’s actual operating performance. It is also a more useful benchmark against industry peers, who are measured on their consolidated rather than entity-level results. The 17.5% entity margin is not wrong — it correctly reflects what each trading entity’s P&L shows — but it cannot be compared to a competitor’s EBITDA margin without adjusting for the management fee structure.
When a group benchmarks entity EBITDA margins against industry comparables, it is comparing numbers that are not on the same basis. Competitors reporting consolidated EBITDA margins have no internal management fee transfers. The entity EBITDA margin is depressed by the fee; the consolidated margin is not. Only the consolidated margin is a like-for-like comparison.
Distortion 3: Intercompany Receivables Inflate DSO and Create False Working Capital Signals
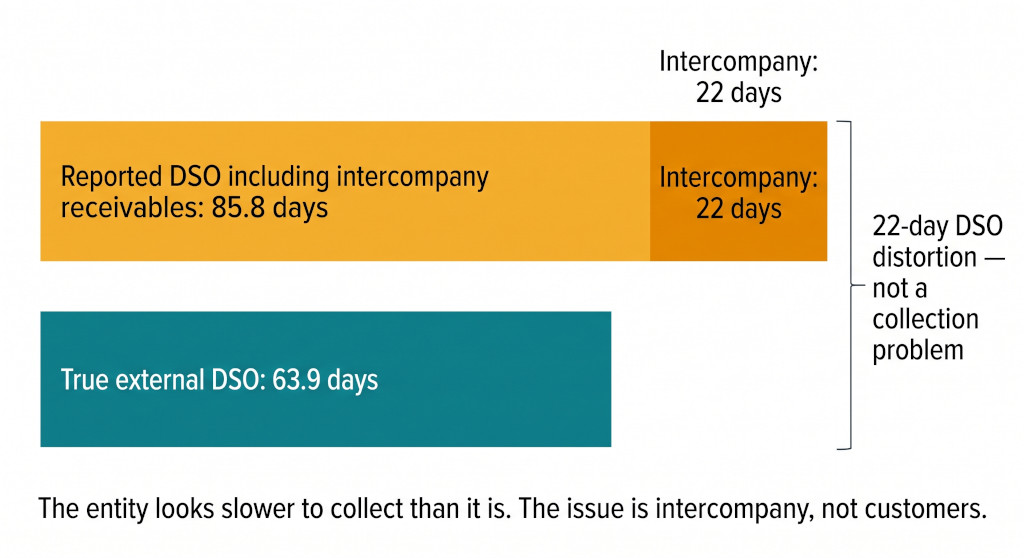
Days Sales Outstanding — the number of days on average that a business takes to collect payment from customers — is one of the most closely watched working capital KPIs for a trading business. A high DSO suggests slow collection, possible credit risk, or poor debtor management. Priya’s board has been pressing Trading Entity A on its DSO of 86 days, which is above the internal target of 70 days and significantly above the industry average of 55–60 days.
The problem is that the DSO calculation is being run on a receivables balance that includes intercompany receivables — money owed by other entities in the Sterling group that has nothing to do with customer collection cycles.
| Trading Entity A — accounts receivable at period-end | £ |
|---|---|
| External trade receivables (from customers) | 350,000 |
| Intercompany receivable — HoldCo management fee recharge reversal | 80,000 |
| Intercompany receivable — shared services recharge from Entity B | 40,000 |
| Total reported receivables | 470,000 |
| DSO calculation | Reported | Ex-intercompany |
|---|---|---|
| Receivables used in calculation | £470,000 | £350,000 |
| External revenue (annualised) | £2,000,000 | £2,000,000 |
| DSO (receivables / revenue × 365) | 85.8 days | 63.9 days |
| Distortion from intercompany receivables | 21.9 days | |
Entity DSO — reported
days — includes £120k intercompany receivables in the numerator
Entity DSO — ex-intercompany
days — external customers only; within the internal 70-day target
The true customer collection performance of Trading Entity A — measured on external trade receivables only — is 63.9 days. This is within the group’s 70-day target and close to the industry average of 55–60 days, accounting for the entity’s typical payment terms. The board’s concern about debtor management is based on a DSO figure that includes £120,000 of intercompany receivables that will never age, never be written off, and carry no collection risk whatsoever. They eliminate in the consolidated accounts.
The credit control team has been spending time chasing collection improvements for a metric that is 22 days inflated by intercompany flows. The improvement programme is addressing a problem that does not exist in the external customer base.
Distortion 4: Revenue Totals That Don’t Add Up
The fourth and most visible distortion is one that Priya’s board notices immediately when comparing entity management packs to the consolidated accounts: the sum of entity revenues (£7,400,000) does not equal the consolidated revenue (£6,500,000). The £900,000 gap is not an error — it is the elimination of intercompany revenue: £600,000 management fee income in HoldCo and £300,000 in shared services revenue generated by one trading entity recharged to others.
But the gap creates a credibility problem. If a board member adds up the entity revenue figures from the management pack and then sees a different number in the consolidated accounts, the instinctive reaction is that something is wrong. Understanding that the difference is structural — not an error — requires an explanation of intercompany eliminations that many board members do not need in other contexts.
The solution is not to hide the reconciliation but to make it explicit. A simple revenue bridge in the group management pack — “Sum of entity revenues £7,400,000 less intercompany eliminations (£900,000) equals consolidated revenue £6,500,000” — converts a source of confusion into a transparent disclosure. The £900,000 elimination is not a deduction from group performance; it is an accounting adjustment that shows the group is not double-counting internal transfers.
How to Present Entity and Group KPIs Without Confusion
The practical response to intercompany KPI distortions is not to abandon entity-level reporting — it serves a legitimate purpose in managing individual business unit performance. The response is to be explicit about which metrics are on an entity basis (including intercompany) and which are on a consolidated basis (eliminations applied), and to present them on a consistent and appropriately labelled basis.
For EBITDA margin
Present entity EBITDA margin in two forms in the management pack: the entity EBITDA margin as reported (including management fee expense), and the entity EBITDA margin before intercompany fees. The first is the entity’s P&L performance as it stands. The second is the entity’s underlying operational performance before the group fee structure is applied. Both are useful; only one is comparable to external benchmarks.
For revenue
Report entity revenue as the entity’s own external revenue — excluding any intercompany management fee income, shared services income, or other intragroup revenue that the entity generates. HoldCo’s management fee income is a group treasury matter, not a revenue line for performance management purposes. Entity managers should not be credited with revenue that does not come from external customers. Group revenue should equal the consolidated revenue figure in the accounts.
For DSO
Calculate entity DSO on external trade receivables only. Intercompany receivables should be excluded from the numerator. If the group’s financial system cannot easily separate intercompany and external receivables in a single report, maintain a secondary analysis that applies the adjustment — the numbers are known from the intercompany reconciliation process and the adjustment takes minutes to apply.
For any ratio using a balance sheet denominator
Working capital ratios, leverage ratios, and asset turn ratios should all be calculated excluding intercompany balances from the denominator (or numerator, depending on the ratio). Intercompany loans, intercompany payables, and intercompany receivables all distort the denominator and produce ratios that cannot be compared to industry benchmarks or covenant tests that are calculated on an external-only basis. The more detailed mechanics of how intercompany balances affect financial ratios are set out in Intercompany Eliminations: A Complete Guide for Group Consolidation.
A Practical Checklist for Intercompany-Clean KPI Reporting
- List every intercompany flow that appears in each entity’s management pack. For each entity, identify which line items contain intercompany transactions: management fee income, management fee expense, intercompany service revenue, intercompany service expense, intercompany loan interest income and expense. This is the starting point for understanding which KPIs are distorted.
- Separate intercompany and external revenue in each entity’s reporting. If the entity’s accounting system records management fee income as revenue, create a separate line item or classification so it can be excluded from the entity’s external revenue KPI. The total entity revenue should be reported as external revenue only when used for KPI purposes.
- Report entity EBITDA both including and excluding intercompany fees. The entity EBITDA including fees is the correct P&L result for the entity and should be maintained for accountability purposes. The entity EBITDA excluding fees is the useful benchmark for operational performance comparison and industry benchmarking. Present both, labelled clearly.
- Exclude intercompany receivables and payables from working capital KPIs. DSO, DPO (days payable outstanding), and net working capital should all be calculated on external balances only. Maintain a mapping of which receivable and payable accounts are intercompany so the exclusion can be applied consistently and automatically.
- Provide an explicit revenue bridge in the group management pack. Show the sum of entity external revenues, the intercompany eliminations, and the consolidated revenue as a three-line reconciliation at the front of the group pack. This converts the apparent discrepancy between entity totals and consolidated revenue into a transparent disclosure rather than a source of board confusion.
- Benchmark at consolidated level, not entity level. When comparing against industry benchmarks, competitor data, or covenant ratios, always use consolidated figures. Entity figures include fee structures, intercompany flows, and transfer pricing arrangements that are not present in an external comparable’s financials.
- Review the KPI framework whenever the intercompany structure changes. A new management fee arrangement, a revised recharge methodology, or the addition of a shared services entity all change which entities carry intercompany flows and how large the distortions are. The KPI framework should be updated whenever the intercompany structure is restructured.
For a full treatment of how to build a group KPI framework that works across both entity and consolidated views, see Group KPI Reporting for Multi-Entity Businesses: The Metrics That Actually Matter. For the definitional standardisation problem — where entities use different formulas for the same KPI — see Why Your Group KPI Report Shows a Different Number for Every Entity. For how intercompany flows eliminate at consolidation and what the mechanics look like in the accounts, see Intercompany Eliminations: A Complete Guide for Group Consolidation.
KPIs that show the group picture and the entity picture — correctly
BrizoConsol separates intercompany flows from external transactions so your entity KPIs and your consolidated KPIs are both right — without manual adjustment at every close. Start Free Trial