Why Every Entity Hit Its Target — But Your Consolidated E-commerce P&L Is Down
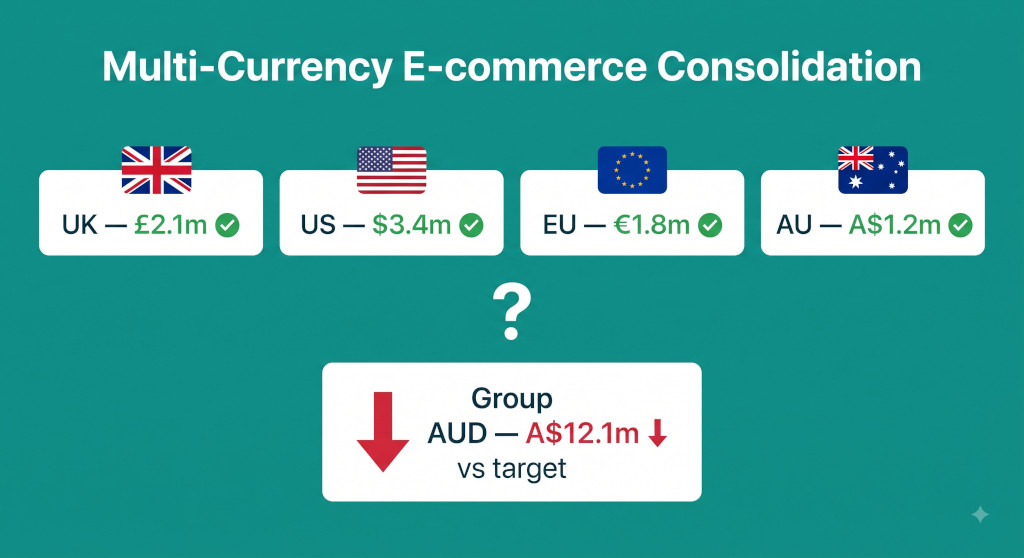
David is the CFO of a four-entity e-commerce group that sells lifestyle products across the UK, US, EU, and Australia. Each entity has a local currency revenue target set at the start of the year. In June, all four entities hit their targets: the UK entity delivered £2.1m against a £2.0m plan; the US entity delivered $3.4m against $3.3m; the EU entity hit €1.8m exactly; and the Australian entity delivered A$1.2m against A$1.1m. By every local measure, it was a good month.
The consolidated group P&L, reported in Australian dollars, told a different story. Consolidated revenue was A$12.1m — A$480,000 below the A$12.58m that David had expected from simply converting each entity’s target at the exchange rates used when the annual budget was set. The board wanted an explanation. David didn’t have one ready, because nobody in the group had been tracking currency movements against the budget rates — and the consolidation process had not been set up to separate currency effects from operational performance.
The shortfall was not a trading problem. It was a translation problem. Between January (when the budget was set) and June (when the month closed), the USD had weakened against the AUD by 4.2%, and GBP had weakened by 2.8%. The entities had performed as planned in their local currencies. The exchange rate had simply moved against the group’s presentation currency, and the consolidated P&L absorbed the impact silently — with no line showing currency effect separately from revenue performance.
Stop building consolidations in spreadsheets.
BrizoConsol automates multi-entity consolidation — setup in minutes, reports the same day.
This is the standard experience for any multi-currency e-commerce group that has not built currency separation into its consolidation reporting. The numbers are technically correct. They are also completely opaque to anyone trying to understand what actually drove them.
Why Multi-Currency Translation Is Different for E-commerce Groups
Currency translation in group consolidation is governed by the same accounting standards regardless of industry — IAS 21 under IFRS, ASC 830 under US GAAP, Section 30 under FRS 102. The rules are consistent: income statement items are translated at the average rate for the period, balance sheet items at the closing rate on the balance sheet date, and the difference between these two rates flows through the currency translation adjustment (CTA) reserve in equity.
What makes e-commerce groups distinctive is the speed and volume at which they accumulate foreign currency exposure, and the number of currencies in play simultaneously. A traditional importer or exporter might have two or three currency exposures. A mid-sized e-commerce group selling on Amazon, Shopify, and its own website across four regions may have revenue streams in six or more currencies — some of which settle through payment processors in a fifth currency before appearing in the entity’s bank account.
Three specific complications arise in e-commerce consolidations that are less common in other industries: payment processor settlement currencies that differ from both the functional currency and the sale currency; high-frequency intercompany stock transfers that create FX exposure on the intercompany balance between transfer date and settlement date; and seasonal volume spikes (Black Friday, end-of-season sales) that concentrate large FX exposures in short windows, making average-rate translation less representative of actual transaction rates than it would be in an evenly-distributed revenue stream.
The translation rules are not discretionary. You cannot choose to translate revenue at closing rates to avoid a negative currency variance, or hold balance sheet items at historical rates to avoid showing a CTA movement. The accounting standard that applies to your group determines the method, and the method must be applied consistently. The answer to currency surprises in the group P&L is not a different translation approach — it is better currency variance reporting layered on top of the correctly translated figures.
The Rate That Applies to What: A Practical Recap
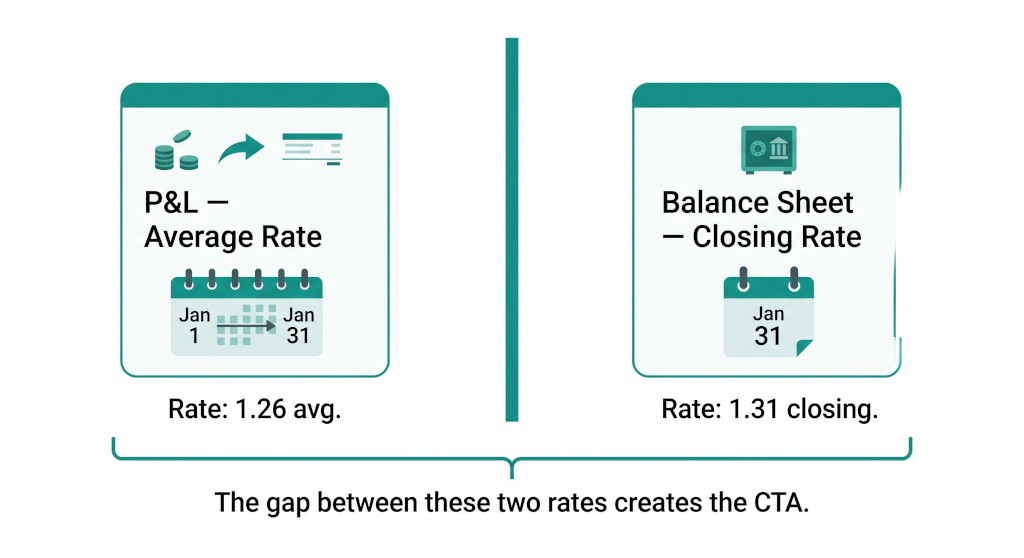
Before diagnosing the variance problem, it helps to be precise about which rate applies to which item — because the most common source of confusion in multi-currency e-commerce consolidations is finance teams applying the wrong rate to the wrong line.
| Item | Translation Rate | Rationale |
|---|---|---|
| Revenue (P&L) | Average rate for the period | Revenue accrues throughout the month; the average rate approximates the blended transaction rate |
| Cost of sales (P&L) | Average rate for the period | Same rationale as revenue — costs accrue throughout the month |
| Other P&L items | Average rate for the period | Consistent treatment across the income statement |
| Trade receivables (Balance Sheet) | Closing rate at period end | Represents the amount the group would receive if collected on the balance sheet date |
| Inventory (Balance Sheet) | Closing rate at period end | Represents the carrying value in presentation currency at period end |
| Intercompany balances (Balance Sheet) | Closing rate at period end | Same as other balance sheet items — the amount to be settled if called at period end |
| Equity (opening balance) | Historical rate (rate when equity was contributed) | Equity is not retranslated — only the movement is affected by current rates |
| CTA (equity reserve) | Calculated — not directly translated | Residual difference arising from using different rates for P&L vs balance sheet |
The CTA is not a separate calculation that someone inputs. It is the mathematical consequence of applying two different rates — average for the P&L, closing for the balance sheet — to the same underlying entity. If the closing rate is higher than the average rate (the foreign currency strengthened during the period), the balance sheet assets translate at a higher value than the P&L earnings that produced them, and the CTA absorbs the difference. If the closing rate is lower, it goes the other way.
For a deeper explanation of how the CTA is calculated and rolled forward across periods, including the journal entries involved, see our guide to how to calculate the cumulative translation adjustment in group consolidation. And for a comparison of how the translation rules differ between IFRS, US GAAP, and UK GAAP, see our post on currency translation under IAS 21, ASC 830, and FRS 102.
Why the Group P&L Will Never Match the Sum of Entity P&Ls
This surprises every finance team the first time they encounter it. If you add up each entity’s revenue in its own currency, convert those totals to the group currency at a single exchange rate, and compare the result to the consolidated revenue figure, the two will not be equal — even if the consolidation is perfectly correct. This is not an error. It is an arithmetic consequence of using period average rates.
The reason: the average rate for the full group period is not the same as the average rate for each entity’s individual period, because the entities may not all operate on identical fiscal months or because revenue is not evenly distributed across the period. More importantly, the entity-level average rate is calculated from the entity’s actual revenue timing — if 60% of the entity’s monthly revenue came in the first ten days of the month when the rate was, say, 1.31, and 40% came in the last twenty days when the rate had moved to 1.26, the blended rate is different from the simple mid-month rate that a finance team might use as a proxy for “the average.”
The practical implication: do not try to verify the consolidated revenue figure by manually converting entity revenues at a single rate. Use the consolidation platform’s output directly, and build your currency variance analysis as a layer on top of it — not as a cross-check to it.
Using the wrong rate as a “sanity check” introduces the very error you are trying to catch. A common mistake is for a finance manager to multiply each entity’s local revenue by the month-end closing rate (easy to look up) and compare the total to the consolidated figure. The consolidated figure uses average rates for the P&L. It will almost always differ from the closing-rate total — and the difference is normal, not an error. Treating that difference as a red flag wastes time and creates unnecessary alarm.
The Payment Processor Currency Problem
E-commerce groups face a specific FX complication that most other industries do not: payment processor settlement. When a customer in Germany buys from the UK trading entity and pays in EUR, the EUR flows through Stripe (or PayPal, or Adyen) before being settled into the UK entity’s GBP bank account. The conversion from EUR to GBP happens at the payment processor’s rate on the settlement date — which is typically two to three business days after the transaction date.
This creates three separate exchange rates for a single sale:
- The rate at which the EUR sale is translated to GBP for the entity’s accounts (the accounting rate — typically the average rate for the period, or the transaction date rate if the entity uses daily rates).
- The rate at which the payment processor converts EUR to GBP on settlement (the processor’s FX rate, which includes a spread).
- The rate at which the GBP entity result is translated to AUD for the group consolidation (the average rate for the month).
The difference between rates 1 and 2 is a realised FX gain or loss in the entity’s books — the difference between what the accounting system expected to receive and what the processor actually converted. This should be showing up in the entity’s P&L as a currency gain/loss on the payment settlement line, separate from trading revenue. In many e-commerce businesses, it is not being tracked separately — the settlement amount is simply booked as revenue, netting the FX difference invisibly into the revenue line.
At the group consolidation level, this means that some of what looks like trading revenue is actually FX gain or loss on payment processor conversion. The consolidated P&L is correct in aggregate — the numbers add up — but the classification is wrong, and any attempt to analyse operating margin or currency exposure from the P&L will be distorted.
The fix is a clean separation at the entity level: revenue is booked at the transaction date rate (or average rate), and the difference between that rate and the processor’s settlement rate is booked to a separate “FX on payment settlement” line below gross profit. This makes the FX impact visible, keeps the revenue line clean, and gives the group-level currency analysis something accurate to work with.
Intercompany FX Exposure on Stock Transfers
In a typical e-commerce group structure, the fulfilment entity buys inventory and transfers it to trading entities. Those transfers are invoiced in a currency — usually the fulfilment entity’s functional currency. The trading entity records the stock at the invoice value in its own currency, using the rate on the transfer date.
Between the transfer date and the settlement date of the intercompany invoice, the exchange rate moves. The fulfilment entity still expects to receive the original invoice amount in its own currency, but the trading entity’s liability in its own currency has changed because of the rate movement. The difference is an FX gain or loss on the intercompany payable.
At consolidation, both the intercompany receivable and the intercompany payable are eliminated — but if they were both translated to the group presentation currency at the same closing rate, the elimination nets to zero cleanly. The complication arises if the fulfilment entity has recognised an FX gain (because the foreign currency strengthened against its functional currency since the transfer date) and the trading entity has recognised an FX loss (the mirror image). Both of those P&L lines survive into the consolidated P&L because they are entity-level gains and losses on what is, at the group level, an internal transaction with no net FX exposure.
These intra-group FX gains and losses on intercompany balances must be eliminated on consolidation, just like the intercompany balance itself. The consolidation journal eliminates the receivable and payable, and also eliminates the FX gain in one entity against the FX loss in the other.
| DR | CR | |
| Intercompany Payable — Trading Entity | A$X | |
| Intercompany Receivable — Fulfilment Entity | A$X |
Eliminates intercompany balance at closing rate — both sides disappear from consolidated balance sheet
| DR | CR | |
| FX Gain — Fulfilment Entity (P&L) | A$Y | |
| FX Loss — Trading Entity (P&L) | A$Y |
Eliminates the mirror-image FX gain/loss on the intercompany balance — the group has no external FX exposure on internal transfers
This elimination is frequently missed in e-commerce groups doing manual consolidations, because FX gains and losses on intercompany balances are often small individually — a few hundred dollars per transfer — but accumulate to material amounts in a group that processes dozens of intercompany stock transfers per month at volatile exchange rates.
Multi-currency consolidation without the monthly rate-hunting
BrizoConsol applies average and closing rates automatically, calculates the CTA, and eliminates intercompany FX gains and losses — so the group P&L shows trading performance, not translation noise.See It In Action
How to Separate Currency Effects From Operating Performance
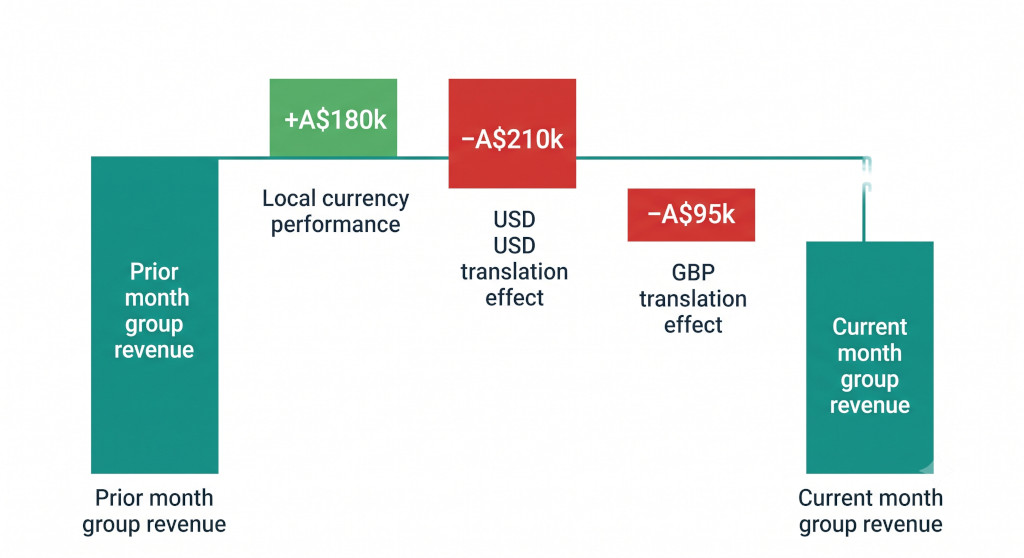
The board question David faced — “why is consolidated revenue down when every entity hit its target?” — cannot be answered by the standard consolidated P&L. The P&L shows the total translated result; it does not show how much of the movement against prior period or budget is currency and how much is trading. Building that split requires an additional layer of analysis that most e-commerce groups do not have in their standard reporting pack.
The currency variance analysis works as follows. For each entity, calculate two figures: what the entity’s revenue would have been in the group currency at the budget rate (the rate used when the plan was set), and what it actually was in the group currency at the actual average rate for the period. The difference between those two figures is the currency effect. Everything left over — the performance against the budget-rate-translated plan — is the trading effect.
Currency variance bridge — June, US Entity (USD, reporting in AUD)
Actual USD revenue: $3,400,000
Budget USD revenue: $3,300,000
At budget rate (USD/AUD 0.64 set in January):
Actual revenue: A$5,312,500
Budget revenue: A$5,156,250
Trading variance (favourable): A$156,250
At actual average rate (USD/AUD 0.612 — USD weakened):
Actual revenue translated: A$5,065,360
Actual at budget rate: A$5,312,500
Currency variance (adverse): −A$247,140
This analysis shows that the US entity outperformed its local currency plan by $100,000 — a trading improvement that translates to A$156,250 at the budget rate. But the USD weakened by 4.4% against the AUD between the budget date and the period close, costing A$247,140 in translation terms. The entity delivered; the currency did not. The net group P&L impact from the US entity is −A$90,890 below budget — not because of anything the US team did, but because of dollar weakness.
Repeating this analysis for each entity produces the currency bridge that David needed to present to his board. The total group shortfall of A$480,000 resolves into approximately A$180,000 of trading outperformance (all entities beat local targets) and A$660,000 of adverse currency effect. That is a very different conversation with the board than “consolidated revenue missed by A$480,000” with no further explanation.
Practical Steps for Building Currency Variance Reporting Into the Monthly Close
The currency variance analysis above requires three pieces of information that most e-commerce groups already have access to but do not organise for this purpose: the budget rates agreed at the start of the year, the actual average rates for each period, and each entity’s revenue in local currency. The calculation itself is straightforward once those inputs are in a consistent format.
- Document and lock the budget rates. At the start of the budget year, agree an exchange rate for each currency pair against the group’s presentation currency. Record those rates in a reference table that is stored alongside the budget and accessible to the group finance team throughout the year. These rates must not change once the budget is signed off — any mid-year reforecast that changes revenue assumptions should restate at the original budget rate, not at a new spot rate.
- Record the actual average rates used in consolidation. For each period close, record the average rate applied to each entity’s P&L translation. This is the rate the consolidation platform used — not a separately sourced rate. Storing it creates a time series that allows period-on-period currency analysis as well as budget comparison.
- Obtain entity revenues in local currency before translation. The consolidation platform translates entity data to the group currency. For the variance bridge, you need the pre-translation local currency figures. Most consolidation platforms can produce these on request; if yours cannot, they should be available from each entity’s own accounting system.
- Prepare the bridge monthly, not quarterly. Currency movements compound. A monthly bridge makes it easier to spot the period in which a material rate movement occurred and to communicate it promptly. A quarterly bridge conflates three months of movement into a single figure that is harder to explain.
- Present the bridge alongside the consolidated P&L in the board pack. The bridge is not an appendix — it is the explanation of the primary P&L movement. Boards of multi-currency e-commerce businesses need the trading vs currency split to assess management performance and to make hedging or pricing decisions. Burying it in supplementary schedules means it will not be read.
For guidance on how the currency variance bridge fits into a full group board pack, see our post on how group CFOs build a consolidated board pack that directors can use. And for the broader e-commerce consolidation context — including intercompany stock elimination and the five-stage close process — see our practical guide to financial consolidation for e-commerce groups.
What Changes When Currency Is Properly Separated
When David’s group built the currency bridge and started presenting it monthly, three things changed. The board stopped treating revenue misses as performance failures when the cause was currency movement — because the bridge made the split unambiguous. The CFO stopped being caught off guard by month-end surprises, because tracking the rate movement against budget rates during the month gave a running estimate of the likely currency impact before the close. And the conversation about hedging became productive, because the group now had a clear view of how much of its consolidated revenue was exposed to each currency pair and in which direction.
The multi-currency translation rules are non-negotiable — average rates for the P&L, closing rates for the balance sheet, CTA for the equity residual. The consolidated numbers will always reflect those rules. What is negotiable is whether the reporting layer on top of those numbers makes currency effects visible or hides them inside a single consolidated variance that the board cannot decompose. Getting the reporting layer right is what turns a technically correct consolidation into one that actually supports decision-making.
Stop explaining the same currency surprise every month
BrizoConsol translates your e-commerce entities at the correct rates automatically, calculates the CTA, and makes it easy to build the trading vs currency bridge your board needs — without manual rate lookups or spreadsheet gymnastics. Start Free Trial