What Should a Group Monthly Management Report Include?
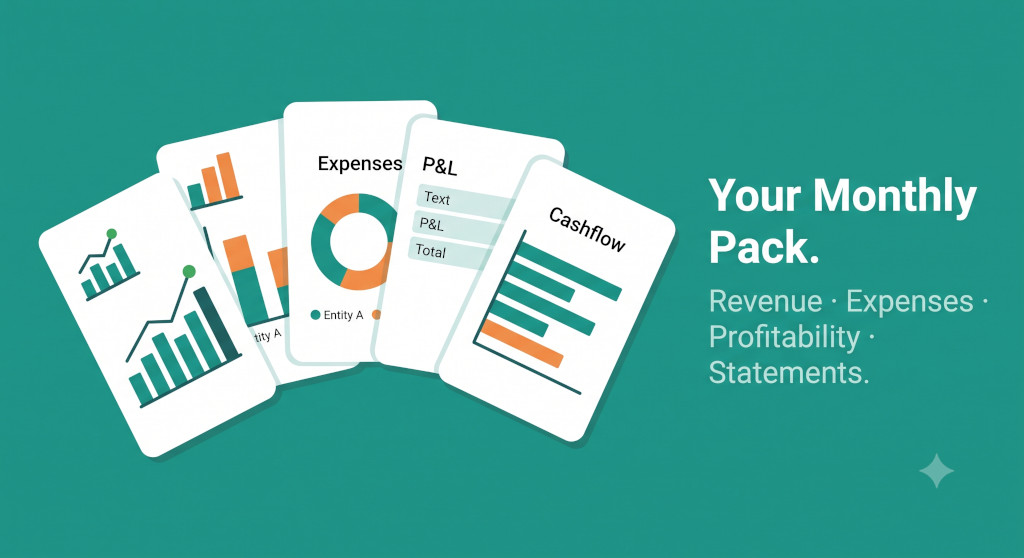
At the close of every month, most group CFOs face the same question from their CEO or operations leads: “How did we do — and why?” A well-built monthly management report answers that in a single document. A poorly built one sends everyone back to the source data to find out for themselves.
The monthly management pack is not the same document as the board pack. A board pack covers governance — agenda, minutes, strategic proposals, risk register, decisions for the quarter. The monthly management pack covers performance — revenue trends, expense by entity, profitability progression, and the three financial statements. Its audience is the finance team and management, not the full board, and its job is analytical rather than procedural.
This guide walks through what a well-structured group monthly management pack should contain, section by section, and why each element earns its place. A free sample pack is available to download at the end.
Stop building consolidations in spreadsheets.
BrizoConsol automates multi-entity consolidation — setup in minutes, reports the same day.
Why Structure Matters More Than Volume
The most common failure mode in monthly management reporting is volume without structure. Finance teams produce pages of data — P&Ls for every entity, budget comparisons, variance schedules — and present them as a stack. The reader gets the numbers but none of the analysis. By the time they’ve found the metric they were looking for, they’ve spent twenty minutes in the document.
A well-structured monthly pack leads with narrative and analysis, saves the raw statements for the back, and presents data visually where charts communicate faster than tables. The reader should be able to understand the month’s performance from the first three sections alone, then drill into the statements if they need the detail.
For multi-entity groups, there’s a second structural requirement: the pack must show both consolidated performance and entity-level movements. A consolidated P&L tells you the group’s net profit. Only entity-level breakdowns tell you which subsidiary drove the cost spike or which geography is outperforming.
Section 1: Executive Summary
The executive summary is the most important page in the pack and typically the last one written. It should be two to five paragraphs of prose — not bullet points — covering the key themes of the month: consolidated revenue and profit performance, any cost governance or entity-level movements worth flagging, cash generation, and a brief forward-looking note on the period ahead.
A useful test for the executive summary: if the CEO read only this page, would they understand the month? If the answer is no, it needs more narrative. If they’d have no reason to read the rest, it has too much detail. The executive summary points; the sections below explain.
Write the executive summary last, from the pack itself — not from the data source. The insights should come from what the analysis sections have surfaced, not from the underlying GL.
Section 2: Revenue Performance
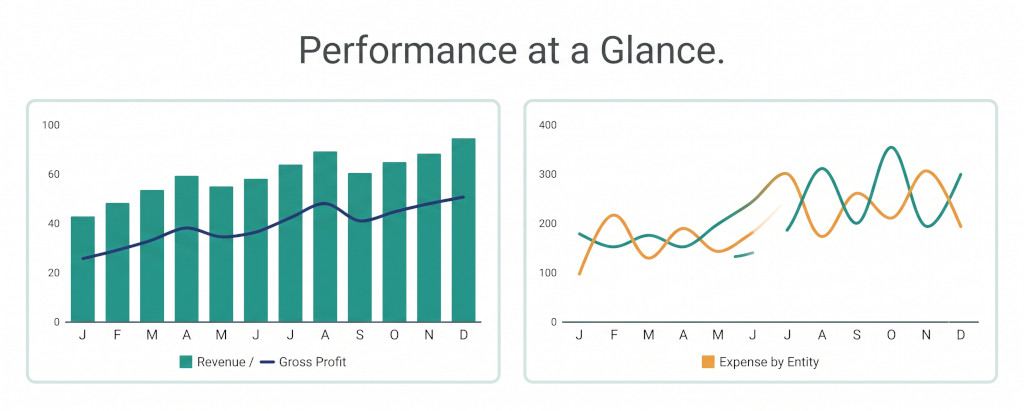
Revenue analysis in a monthly pack has three layers: trend, account breakdown, and gross profit.
Sales trend. A 12-month rolling bar or line chart showing total revenue by month gives management the trajectory immediately. A single month’s number is almost meaningless without context — the trend reveals seasonality, growth rate, and any inflection points worth investigating. Pair the chart with a brief written commentary on what drove the period’s result.
Top sales by account. A table showing the top revenue-generating accounts or customers for the period makes the trend concrete. If one account represents a disproportionate share of total revenue, management needs to see that clearly — not infer it from a consolidated total. This section is also where concentration risk becomes visible at a glance.
Income and gross profit analysis. Revenue alone is incomplete without gross profit alongside it. A combined chart showing revenue, gross profit, and GP% over 12 months lets management track whether margin is holding as volume moves. If revenue rises but GP% falls, that’s a story the pack should surface explicitly, not leave for the reader to calculate.
Section 3: Expenses Breakdown
Expense analysis is where the entity-level view becomes essential. A consolidated expense total tells you how much the group spent. An entity-level breakdown tells you where — and that’s the question management actually needs answered.
Expense by entity. A line chart showing each entity’s expense trend over 12 months makes it immediately clear if one subsidiary’s costs are rising while another’s hold flat. For groups with entities across different functions — a service company and a sales company, for example — the divergence often reflects structural differences rather than inefficiency, but management needs to see it to make that judgement.
Expense distribution. A high-level commentary on how total expenses are distributed across the group — which entities or functions carry the largest cost base — contextualises the entity trend chart. This is particularly useful for groups that have added entities through acquisition and are still calibrating expected cost levels.
Top expenses by account. A table of the largest expense accounts — payroll, rent, utilities, marketing, general administration — gives management a direct view of where the money is going. Pairing each account with its prior-year or budget figure makes it easy to identify which line items are running above expectation.
Avoid the “everything is fine” expense section. If the pack reports expenses without commentary — just a chart and a table — readers can’t tell whether the numbers are expected or anomalous. Every expense section should include at least a sentence on whether the period’s results reflect normal trading, seasonal patterns, or something that warrants attention.
Section 4: Profitability Insights
After revenue and expenses, profitability analysis brings them together — not just as a mathematical output, but as a narrative about the group’s financial trajectory.
Net profit and operating expense trend. A 12-month chart plotting net profit and operating expenses together shows management the relationship between cost management and bottom-line outcome. A month where operating expenses fall but net profit rises confirms cost discipline is translating to results. A month where both fall at once may reflect revenue pressure.
Net profit margin. Presenting net profit margin as a percentage alongside the absolute number helps management contextualise performance across months of different revenue scale. A margin chart also makes it clear faster than an absolute profit chart when pricing pressure or input cost changes are beginning to affect the business.
Other income. For groups with finance income, share of profit from associates, or non-operating revenue, the profitability section should account for other income explicitly and explain its components. This prevents management from misreading operating performance — a month with strong other income but weak operating profit looks healthy at the net level but warrants closer attention at the operating level.
The profitability insights section should bridge the revenue and expense analysis to the financial statements. By the time the reader reaches the P&L, they should already understand the key movements — the statement is confirmation, not discovery.
Free Sample: Group Monthly Management Pack
Download a full sample monthly management pack — including Executive Summary, Revenue Performance, Expenses Breakdown, Profitability Insights, P&L, Balance Sheet, and Cashflow — to use as a reference when building your own.Download Sample Pack (PDF)
Build Your Monthly Pack in BrizoConsol
BrizoConsol consolidates your group financials automatically — and lets you produce monthly management packs as branded Insight Packages delivered to every stakeholder, without the manual rebuild each month.
Section 5: Financial Statements
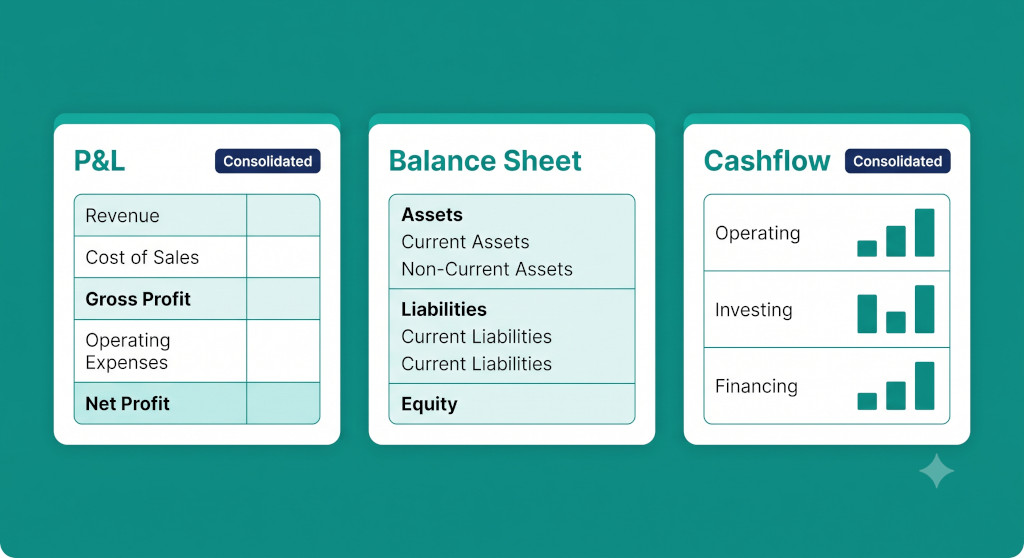
The financial statements come at the back of the monthly management pack — not because they’re less important, but because the analysis sections have already told the story. By the time the reader reaches the statements, they’re looking for confirmation and detail, not orientation.
A well-formatted monthly management pack includes all three statements, each with comparative columns that allow quick comparison against prior periods and budget.
Profit and Loss
The consolidated P&L should show the current month, the prior-year comparative for the same month, year-to-date actuals, YTD prior year, and budget where available. Variance columns — both absolute and percentage — make it immediately clear where performance is ahead or behind expectation.
The structure should flow through the key profit subtotals: revenue, cost of sales, gross profit, operating expenses, operating profit, other income, profit before tax, tax, and profit after tax. Groups that consolidate across entities with meaningful variance between actuals and budget will often add a “% of revenue” column as well, which helps management assess the cost structure in proportional terms.
| Line Item | Current Month | Prior Year | YTD Actual | YTD Prior Year |
|---|---|---|---|---|
| Revenue | 70,754 | 63,210 | 412,300 | 389,140 |
| Cost of Sales | (15,829) | (14,205) | (89,415) | (83,620) |
| Gross Profit | 54,925 | 49,005 | 322,885 | 305,520 |
| Operating Expenses | (34,419) | (31,840) | (198,720) | (187,900) |
| Operating Profit | 20,506 | 17,165 | 124,165 | 117,620 |
| Other Income | 2,609 | 1,880 | 14,350 | 10,920 |
| Profit Before Tax | 23,115 | 19,045 | 138,515 | 128,540 |
| Tax | (6,144) | (5,050) | (36,760) | (34,100) |
| Profit After Tax | 16,971 | 13,995 | 101,755 | 94,440 |
Balance Sheet
The consolidated balance sheet in a monthly management pack typically shows the current month-end position alongside the prior year-end balance. Unlike the P&L, which is inherently comparative (period-on-period performance), the balance sheet tells a point-in-time story: what the group owns, what it owes, and what remains as net equity.
For management purposes, the most watched lines tend to be trade receivables (cash conversion risk), inventory levels (operational capital), trade payables (supplier obligations), and net debt. Groups with non-controlling interests should show NCI as a separate equity component — it’s a regular feature of consolidated balance sheets for groups with partially owned subsidiaries.
Cashflow Statement
The cashflow statement closes the monthly pack by answering the question that revenue and profit figures alone cannot: how much cash did the group actually generate, and where did it go?
Operating cashflow should reconcile from profit before tax through working capital movements. Investing activities should reflect any capital expenditure or investment activity during the period. Financing activities capture debt drawdowns, repayments, and dividend distributions. The closing cash balance — and its movement from the prior month — is the number that treasury and the CFO will typically go to first.
For groups with entities in multiple currencies, the cashflow statement should reflect translated values in the group’s reporting currency, consistent with the P&L and balance sheet. Group reporting across currencies introduces translation differences that need to be handled consistently across all three statements.
Monthly Management Pack vs Board Pack: What’s Different
Because both documents go to senior stakeholders, the distinction between a monthly management pack and a board pack can blur in practice. The table below sets out the key differences.
| Element | Monthly Management Pack | Board Pack |
|---|---|---|
| Primary audience | CFO, finance team, management | Board of directors |
| Frequency | Monthly | Quarterly or each board meeting |
| Primary focus | Financial performance & trends | Governance, strategy, decisions |
| Governance sections | No — no agenda, minutes, or attendees | Yes — agenda, minutes, committee reports |
| Entity-level breakdown | Yes — expense by entity, entity trends | Typically group-level only |
| Risk register | No | Yes |
| Forward-looking proposals | No | Yes — plans, capex proposals, approvals |
| Visual analysis emphasis | High — charts, trends, margin lines | Moderate — financial summaries, KPI dashboard |
In practice, some groups produce both documents from the same underlying data — the management pack monthly, the board pack quarterly — with the board pack pulling a summary of the last quarter’s management pack figures alongside its governance sections. The two serve different purposes and different audiences; treating them as the same document produces something that does neither job well.
Who Receives the Monthly Management Pack?
Distribution matters. The monthly management pack typically goes to the CFO, CEO, group controller, and any finance manager with entity-level responsibility. For groups where operational managers have P&L accountability — a regional director, a subsidiary MD — the pack or a relevant subset of it should go to them too, particularly the entity-level expense and revenue sections.
For groups with external investors or lending covenants tied to financial performance, a version of the management pack may form the basis of investor reporting obligations. In these cases, presentation quality becomes as important as analytical depth. Automating report delivery to each stakeholder type — with the right level of detail for each audience — removes the manual overhead of maintaining multiple versions of the same underlying data.
Consider role-based access controls when sharing management pack data digitally. Consolidated financial data is sensitive — entity managers typically need access to their own entity’s performance, not every subsidiary’s numbers.
A Checklist for Your Monthly Management Pack
- Executive summary — written prose, 2–5 paragraphs, covering revenue, costs, cash, and any forward-looking note
- Revenue performance — 12-month sales trend chart, top accounts table, gross profit analysis with GP%
- Expenses breakdown — expense by entity (chart), total expense commentary, top accounts by spend
- Profitability insights — net profit trend, net profit margin %, other income with account breakdown
- Profit and Loss — current month vs prior year, YTD vs prior YTD; variance columns
- Balance Sheet — current month-end vs prior year-end; NCI shown as separate equity component where applicable
- Cashflow statement — operating, investing, financing activities; closing cash balance
Download the Sample Monthly Management Pack
See how all seven sections fit together in a complete, production-ready example — including executive summary narrative, revenue analysis charts, entity-level expense breakdown, profitability insights, and all three financial statements. Download Sample Pack (PDF)
Automate Your Monthly Management Pack
BrizoConsol pulls consolidated data from your accounting software, eliminates intercompany transactions automatically, and produces monthly management packs as branded Insight Packages — delivered to the right stakeholders, every month, without the manual rebuild.