Your Financials Tell Half the Story. Now You Can Bring the Other Half In.
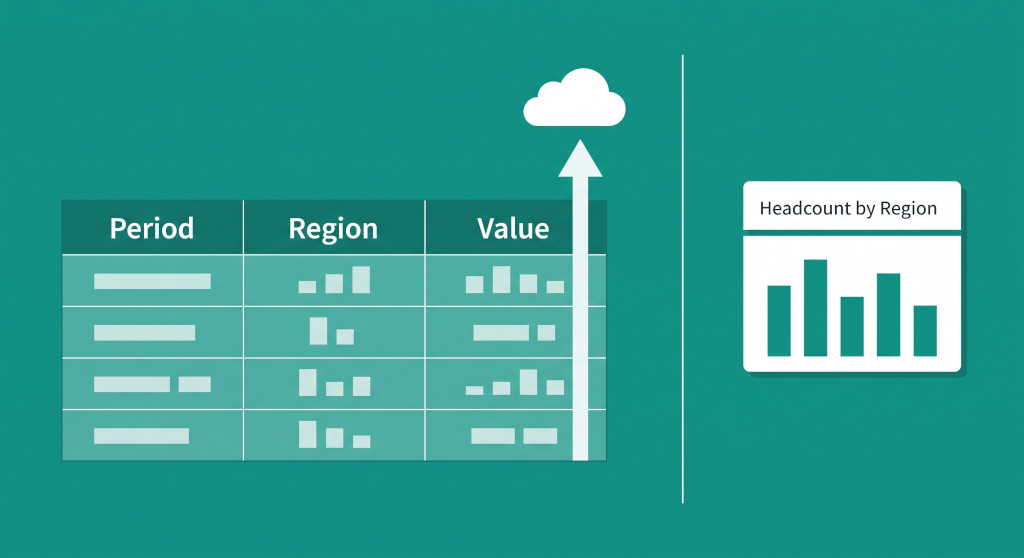
Every consolidation pack we have ever reviewed contains at least one spreadsheet that sits outside the accounting system. Headcount by department. Units shipped by region. Active customer counts by subsidiary. Leads in the pipeline. These numbers matter — a group CFO presenting to the board wants to place payroll costs next to headcount, or freight costs next to shipment volumes — but the general ledger has never been the right home for them, and exporting both datasets, merging them in Excel and rebuilding the chart each month is exactly the kind of manual overhead that consolidation software is supposed to eliminate.
Until now, BrizoConsol handled this the same way every other consolidation platform does: the financial data lives in the system; the operational data lives in a spreadsheet on someone’s desktop; and the user glues them together before the board pack is due. As of this release, that workaround is gone. The new Operational Data feature lets you upload any CSV of business metrics directly into BrizoConsol, attach it to a chart-of-accounts line if you want one, and have it appear automatically in your dashboards, cell-based reports and consolidated pack — updated each month in minutes, not hours.
This post walks through exactly how the feature works, what you need to prepare, and the practical decisions you will make the first time you set up a dataset.
Automate NCI calculations across all your entities.
BrizoConsol handles non-controlling interest automatically — no manual adjustments required.
What Operational Data Means in BrizoConsol
In BrizoConsol, an operational dataset is a named table of time-series values that you upload as a CSV. Each row carries at minimum a period (a month such as Jul-2026) and a value. Beyond those two required fields, you can add up to three dimension columns — freeform text groupings such as Department, Region or Product Line — and optionally an account link that ties each row to a line in your chart of accounts.
Once a dataset is loaded, BrizoConsol treats it as a first-class data source alongside the trial balances your integrations or CSV imports bring in. It appears in the dashboard block picker, in the cell-report binding editor, and — if it is owned by a subsidiary — it is visible to the consolidated parent when the parent is reviewing the group. No configuration change is needed for that visibility; datasets follow the same organisation hierarchy your financial data already uses.
The feature is completely open-ended about what you put in it. Common uses we expect to see include:
- Headcount by department or legal entity (for payroll ratio analysis)
- Units sold, shipped or produced by product line (for margin-per-unit calculations in cell reports)
- Customer or subscriber counts by segment (for revenue-per-customer KPIs)
- Leads and pipeline values from a CRM export (for sales efficiency dashboards)
- Square footage or store count for retail real estate ratios
- Anything else that has a monthly figure and is currently living in a spreadsheet
Setting Up a Dataset: Two Steps, One Dialog
Creating a dataset is a two-step flow. The first step defines the dataset’s structure; the second step brings in the data. BrizoConsol separates them deliberately so you can save the definition, share the template with a colleague to fill in, and upload later — without losing your configuration.
Step 1: Define the dataset. Open Operational Data from the sidebar and click New dataset. Give it a name (required) and an optional description. Then decide how many dimension columns your CSV will carry — none, one, two or three — and label each one. The label you type here (“Department”, “Cost Centre”, “Region”) is what appears in filter panels, pivot builders and dashboard cards throughout the system. Choose a label that matches the column header in your source spreadsheet to make column-mapping obvious in step 2.
The definition also covers three settings that go beyond structure: account, scenario, and currency translation.
The account setting has three modes:
- No account link — the dataset is purely operational; values stand on their own.
- Single account for the whole dataset — you pick one line from the chart of accounts and every uploaded row is tied to it. Useful for headcount, where you want to cross-reference payroll costs.
- Account column in the file — the CSV itself carries an Account column, so different rows can belong to different accounts. Useful for a multi-product sales dataset where each product maps to its own revenue account.
The scenario setting tells BrizoConsol which reporting scenario this data belongs to — the same three scenarios the rest of the platform works with: Actual, Forecast and Budget. There are two modes here as well:
- One scenario for the whole dataset — every row carries that scenario, and dashboards and reports read it by name. Changing the setting rewrites every existing row.
- Scenario column in the uploaded file — each CSV row carries its own Actual, Forecast or Budget label, so a single dataset can hold all three. When you view that dataset in the pivot, BrizoConsol automatically spreads scenarios across the columns so actuals and forecast are never silently added together.
The currency translation setting is relevant when your group consolidates entities in different currencies (available on Multi-currency editions). It controls how uploaded values are converted into the viewer’s reporting currency:
- No translation — values are used exactly as uploaded. Use this for counts, units, headcount, or any metric that is not money.
- Average rate — values are translated at the period’s average exchange rate, the same rate used for profit-and-loss accounts.
- Closing rate — values are translated at the period’s closing rate, the same rate used for balance-sheet accounts.
When each subsidiary uploads its own version of the same dataset and the translation mode is set, BrizoConsol translates each entity’s rows into the group currency before aggregating. A “Revenue by Product” dataset that three subsidiaries contribute to becomes one group-level view with no manual conversion step.
Once you save the definition, BrizoConsol creates the dataset and opens step 2.
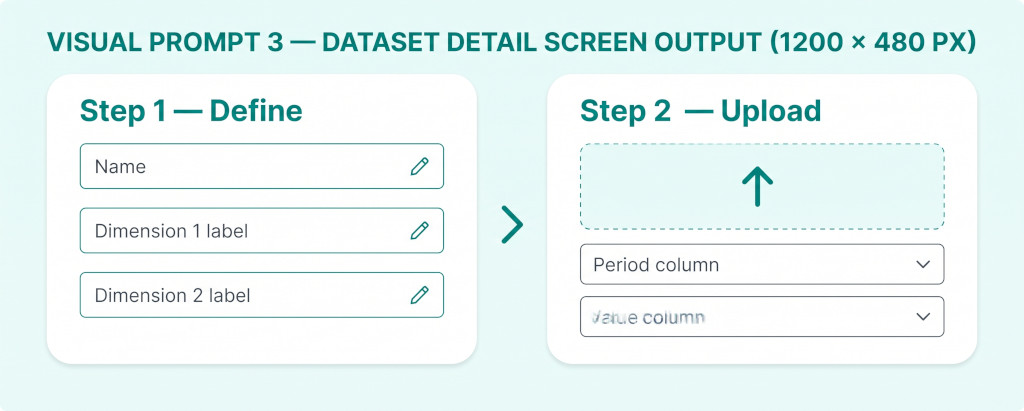
Step 2: Upload the CSV. A Download template button produces a CSV pre-built from the dimension labels you typed. It contains three sample rows so you can see the expected format before filling it in. Period values can be written as Jul-2026 or 2026-07 — the importer accepts both. Drag the completed file onto the upload zone (or click to browse), and the system reads the headers and pre-selects the column mapping for you. It guesses which column is “Period” and which is “Value” from the header names and the data it finds there; you can override any of its choices before submitting.
One additional decision at upload time: the replace mode. The default is Replace periods covered by this file, which means only the months present in your CSV are updated; every other month in the dataset is left exactly as it was. This is the right choice for a monthly update — the HR team sends September headcount, you upload it, and January through August are untouched. The alternative, Replace entire dataset, clears everything first and reloads from the file; use this when you are doing a full historical backfill or correcting a previous full upload.
See Operational Data in your own consolidation
BrizoConsol is free to try. Set up a dataset in under five minutes with a spreadsheet you already have. Start Free Trial
What Happens Behind the Scenes on Import
When you submit the upload, BrizoConsol reads the CSV row by row and does the following for each one:
The period cell is parsed into a YYYY-MM canonical form. Any row whose period cannot be parsed — a blank cell, a free-text label that was not recognised — is counted as skipped rather than silently dropped; the upload summary shows you exactly which raw values could not be read, so you can fix the source file and re-upload.
If the dataset uses account-column mode, BrizoConsol looks up the account by matching the cell value against every sensible spelling of each account: the full label G-4000 - Sales Revenue, the code alone G-4000, and the account name on its own. If a value in the Account column does not match anything in the chart of accounts, the row is still imported but the account link is left null, and the upload summary lists every unmatched account code so you can correct them.
Once all rows have been parsed, BrizoConsol clears the rows it is replacing (the affected months in period mode, or everything in full-replace mode) and inserts the new rows in bulk. When the dataset uses scenario-column mode, the clear step is scoped to the scenarios actually present in the uploaded file — so uploading a Forecast file for September never deletes that same month’s Actual rows. The dataset’s row count is updated, and the summary returned to your screen shows: rows imported, rows removed, any skipped periods, any unmatched accounts, and any rows that carried an unrecognised scenario value.
Any CSV columns that were not mapped to a required field (not Period, Dimension or Value) are stored as extra columns on each row. They show in the row’s expanded detail view and are available for future filter extensions — nothing in your file is discarded.
Validation: Does Your Upload Agree With the Ledger?
When a dataset is linked to one or more accounts, BrizoConsol automatically compares what you uploaded against those accounts’ actual movements in the trial balance — month by month, after every import.
This check is informational. An upload is accepted whatever it holds; a mismatch never blocks the data from loading. But the validation panel on the dataset detail screen tells you, for each month, what was uploaded, what the ledger shows for those accounts, and the difference. A month within half a cent of the ledger is marked as “tied.” A month with no ledger entry at all (perhaps the account was introduced partway through the year) is marked separately so it does not look like a genuine mismatch.
In practice, this means a headcount dataset linked to a Payroll account will immediately tell you if the average-cost-per-head implied by your upload is wildly inconsistent with what was actually posted. That is the kind of cross-check that previously required building a separate reconciliation tab in the board-pack spreadsheet.
A Worked Example: Headcount by Department
Consider a group with three operating entities — Singapore, Australia and UK. The group CFO wants a dashboard card showing total headcount by department each month, alongside payroll costs per head. Each entity’s HR system produces a monthly CSV export.
The finance team creates one dataset per entity in BrizoConsol, each named “Headcount” and owned by that entity’s organisation. Each dataset has one dimension labelled “Department” and uses the single-account setting pointing to the Payroll expense account in that entity’s chart of accounts.
The Singapore CSV for September 2026 looks like this:
| Period | Department | Value |
| Sep-2026 | Engineering | 42 |
| Sep-2026 | Sales | 18 |
| Sep-2026 | Operations | 27 |
| Sep-2026 | Finance | 9 |
| Total headcount | 96 |
After upload, the validation panel compares 96 total headcount against the September Payroll account movement of SGD 1,152,000. The implied average cost per head is SGD 12,000 — consistent with the prior month, so the month is marked as “tied” in the validation view (noting that the comparison is on values, not on a derived ratio, but the finance team has set the value column to headcount rather than cost).
On the group dashboard, the consolidated parent now sees four blocks automatically: the three per-entity blocks (“Headcount (Singapore) by Department”, “Headcount (Australia) by Department”, “Headcount (UK) by Department”) and a fourth group block — “Headcount (Singapore + Australia + UK) by Department” — that combines all three entities into one view. In the group block, Engineering headcount from all three entities is summed into a single row, Operations from all three into another, and so on. Because each dataset has a currency translation setting (or in the case of headcount, “no translation”), the values are combined directly: 42 + 31 + 18 engineers equals 91, regardless of which currencies each entity operates in.
For the payroll-cost-per-head KPI in the consolidated cell report, the finance analyst uses the cell binding editor to pull the headcount value for Engineering from the Singapore Headcount dataset and divide it into the Payroll account’s movement for the same period. That binding updates automatically every time a new month’s headcount file is uploaded.
Viewing, Filtering and Pivoting Your Data
The dataset detail screen offers two view modes. The detail rows view lists individual records with their period, dimension values and amount. The pivot view lets you drag dimension fields into row and column buckets, choose between Sum of Value and Count of rows as the measure, and apply any combination of period-range, dimension and account filters. Both views export to PDF and Excel, and what is exported is exactly what is shown — filters, layout and view mode all carry through to the export.
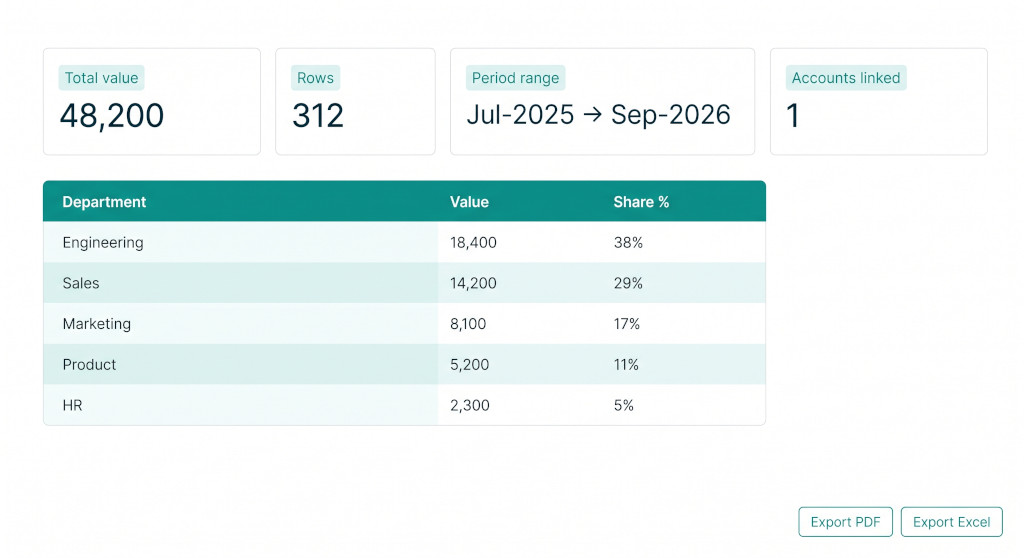
Four stat tiles at the top of the screen give an at-a-glance summary: total value across all filtered rows, row count, the earliest and latest period in the current filter, and the number of distinct accounts the rows are linked to. These update live as you adjust filters.
If you need only a subset of months, the period-from and period-to pickers let you narrow the view without clearing the underlying data. Dimension filters work as multi-select dropdowns populated from the actual values in the dataset. Account filters appear when the dataset carries account links.
Scenarios: Actual, Forecast and Budget in One Dataset
Operational data is not just historical. You may want to upload a headcount forecast alongside actuals, or a budget for pipeline figures alongside what was achieved. BrizoConsol handles this with the same Actual / Forecast / Budget structure the rest of the platform uses — but with a choice about how those scenarios are stored.
When you choose One scenario for the whole dataset, every row in that dataset is tagged with a single scenario: Actual, Forecast or Budget. This is the right choice when your HR system produces one actuals file each month and that file should never mingle with forecast data. You can create a second dataset named “Headcount Forecast” using the same dimension structure and set it to Forecast. The two datasets remain separate, and dashboards or reports that are toggled to the Forecast scenario will read from the forecast version; when toggled to Actual, they read from the actuals version.
When you choose Scenario column in the uploaded file, the CSV itself carries an Actual, Forecast or Budget value on each row. A single dataset can then hold all three scenarios simultaneously — for example, actuals for closed months and a forecast for open months in the same file. BrizoConsol recognises the values case-insensitively (“actual”, “Actual”, “ACTUAL” are all equivalent). Any row with an unrecognised scenario value is skipped rather than imported with a wrong tag, and the upload summary lists the raw values that were not recognised so you can correct them.
In the pivot view, whenever a dataset holds more than one distinct scenario, BrizoConsol automatically spreads them across the columns rather than summing them together. You will see separate columns for Actual and Forecast, making variance analysis possible directly in the pivot without any extra configuration. The detail-rows view similarly surfaces a Scenario column only when the dataset holds mixed scenarios — for single-scenario datasets the column is hidden to keep the screen clean.
A practical default for most teams: use “One scenario for the whole dataset” when the data comes from a system that exports only actuals, and switch to “Scenario column in the uploaded file” when you manage actuals and a rolling forecast in the same spreadsheet and want both in BrizoConsol at once.
Currency Translation for Multi-Entity Groups
In a single-entity setup, operational data values are used exactly as uploaded. In a multi-entity group where subsidiaries operate in different currencies, uploaded values need to be converted into the group’s reporting currency before they can be meaningfully aggregated at the parent level.
BrizoConsol handles this through the currency translation setting on the dataset definition. Three options are available:
No translation is the correct choice for any measure that is not money: headcount, unit counts, square footage, number of stores, count of active customers. Adding these figures across currencies is mathematically correct as-is — 96 employees in Singapore plus 43 employees in Australia is 139 employees regardless of exchange rates. Choosing “no translation” tells BrizoConsol to add the figures directly.
Average rate applies the same rate used for profit-and-loss accounts: the average exchange rate for the month. Use this when the operational values represent a monetary flow — pipeline value contributed during the month, revenue by product line, sales commissions. These are period amounts, and the average rate is the conventional translation for P&L items.
Closing rate applies the period-end rate, the same rate used for balance-sheet positions. This is appropriate for monetary stock figures — outstanding loan balances by borrower, inventory value by warehouse — where the balance at a point in time matters rather than the flow during the month.
Translation happens at read time, not at import time. Uploaded values are stored in the entity’s own currency; when a dashboard card, report or chart reads a group block that spans entities, each row is translated individually into the reporting currency before the rows are grouped and summed. This matters for accuracy: BrizoConsol is converting each entity’s contribution separately, then adding the converted figures — it is not converting a combined total, which would be wrong when entities uploaded different amounts in different currencies.
The exchange rates used are the same rates already configured in BrizoConsol for financial consolidation — the same monthly average and closing rates applied to trial balance accounts. No separate rate setup is required. Rates are also scenario-specific: when you view Actual data, BrizoConsol applies Actual-period exchange rates; when you view a Forecast, it applies Forecast-period rates, matching the convention used for translated trial balance figures elsewhere in the platform.
When an entity’s own currency matches the reporting currency, no rate lookup is needed for that entity’s rows and no rate needs to exist. If a rate is missing for a currency and month, BrizoConsol leaves that entity’s rows in their uploaded values and logs a warning — the consolidated block still renders, but that one entity’s contribution for that month is untranslated. Missing rates should be investigated in the exchange rate setup screen, which lists each currency the group works with and the months each one is covered for.
Translation is available on multi-currency editions of BrizoConsol. When the setting is visible but the translation options are greyed out, the current subscription plan does not include multi-currency consolidation; the edition note next to the dropdown identifies the plan required.
How Operational Data Consolidates Across Entities — and Appears in Dashboards
Every dataset you upload appears automatically in the dashboard block picker and in the cell-report binding editor. You do not need to configure anything extra — as soon as the data is in, BrizoConsol generates a block for each combination of dataset and grouping basis.
For a dataset with two dimensions labelled “Region” and “Product”, BrizoConsol creates three blocks: one grouped by Region, one grouped by Product, and one grouped by Account (if the dataset carries account links). Each block appears in the picker as, for example, “Headcount by Region” or “Headcount by Product.” When a parent entity views the picker, it also sees its subsidiaries’ individual blocks, each labelled with the owning entity’s name in parentheses — “Headcount (Singapore) by Region”, “Headcount (Australia) by Region” — so the entity-level data is always accessible separately.
Beyond the per-entity blocks, BrizoConsol also generates consolidated group blocks automatically. When two or more subsidiaries have datasets that share the same name and the same dimension labels — which is the natural outcome when each entity uploads its own “Headcount” dataset with a “Department” dimension — BrizoConsol recognises them as the same kind of data and creates one additional block covering all of them together. That block appears in the picker as “Headcount (Singapore + Australia + UK) by Department” and, when charted or tabled, combines all three entities’ rows into one view: rows with the same dimension value (for example, “Engineering”) are summed into a single row, giving you group headcount by department without any manual merge step.
For datasets in different currencies, currency translation is applied per row — each entity’s individual rows are converted into the reporting currency first, then the converted values are summed by dimension group. The Singapore dataset’s rows translate from SGD row by row, the UK dataset’s from GBP row by row, both into the group’s reporting currency, and only then are the “Engineering” contributions from each entity added together. The matching logic that identifies which datasets belong together uses name, dimension labels, scenario mode, scenario value (when in dataset mode) and account mode — all compared case-insensitively. A slight naming difference (“Head Count” vs “Headcount”) is enough to produce separate individual blocks rather than a group block, so consistent naming across entities is important.
Dashboard cards built on operational datasets support the same chart types as financial blocks — bar charts, line charts, number cards and tables — and the same period navigation. A table card built on a dataset shows the group label, the sum of value and the percentage share by default, with Count of records and Average value per record available as optional extra columns.
Table cards now support drill-through. Clicking any cell in a table card built on an operational dataset opens the underlying records for that measure and period, so you can move from a group-level headcount total directly into the individual rows that make up that figure. Prior-year comparison columns work the same way — clicking a prior-year cell drills into that month’s records, not the current month’s, which is the behaviour you need when investigating a year-on-year movement.
Building KPIs That Combine Operational and Financial Data
Uploading operational data is useful on its own — but the real gain comes from building KPIs that put a financial figure next to an operational one. BrizoConsol’s KPI builder now supports dataset rows alongside the existing ledger rows, so a single formula can reference both the trial balance and any operational dataset you have loaded.
In the KPI builder, a dataset row works like this: you pick a dataset from the dropdown, optionally narrow it by pinning one or more dimension values, optionally pin a scenario, and choose a basis (Movement for a period total, Balance for a closing figure). The row is then labelled automatically — “Dataset: Headcount”, “Dataset: Headcount – Department: Engineering”, and so on — so the formula stays readable as it grows. Subsidiary datasets appear in the picker with the entity name in parentheses, so a group building a cross-entity KPI can see and select each entity’s dataset explicitly.
Dimension pinning is cascaded. If you pin Department first, the next picker shows only the values that exist for that department — the same narrowing logic a data analyst would want to avoid accidentally building a formula that reads zero because a combination never existed in the upload.
By default a dataset row follows the scenario the KPI card is currently evaluating. When the card is toggled to Actual, the row reads Actual data; toggle it to Budget, it reads Budget. You can override this and pin a specific scenario on one row — useful when a formula compares an actual figure against a budget target, both in the same card.
Example 1 — Cost per Head (non-financial metric driving a financial ratio)
The group wants a dashboard KPI showing monthly payroll cost per employee, broken down by department. In the KPI builder, the formula has two rows:
| Row | Type | Basis |
| Payroll account | Ledger row | Movement |
| Headcount – Department: Engineering | Dataset row | Movement |
| Formula: Row 1 ÷ Row 2 | = Cost per head | |
Payroll comes from the trial balance; headcount comes from the operational dataset pinned to the Engineering department. The result is cost per Engineering head for the month. Remove the department pin and the formula gives you total payroll cost per head across the whole organisation. Add the KPI card to the dashboard and it updates automatically each month as new headcount files are uploaded — no manual spreadsheet calculation required.
For a multi-entity group, add one Headcount dataset row per entity — “Dataset: Headcount (Singapore)”, “Dataset: Headcount (Australia)”, “Dataset: Headcount (UK)” — summed together in the formula’s denominator. Each entity’s dataset total is translated to the reporting currency using that dataset’s translation setting before being added. The Payroll ledger row is consolidated in the normal way, so the resulting KPI is a true group-level cost per head.
Example 2 — Revenue per Active Customer (operational metric scaling a financial result)
The business wants to track monthly recurring revenue per active customer — a metric that is partly financial (revenue is in the ledger) and partly operational (customer count is in an uploaded dataset).
| Row | Type | Basis |
| Subscription Revenue account | Ledger row | Movement |
| Active Customers – whole dataset | Dataset row | Balance |
| Formula: Row 1 ÷ Row 2 | = Revenue per customer | |
Revenue is a movement — the month’s billings. Customer count is a balance — the figure at the end of the month, not a flow during it. Selecting “Balance” as the basis for the dataset row tells BrizoConsol to take the closing value for the period rather than summing the period’s activity. The result is the average revenue generated per customer on the books at month end.
Because the KPI responds to the scenario toggle, the same formula also gives you a Forecast view when a Forecast customer count has been uploaded: toggle the card to Forecast and the formula reads the forecast customer figures alongside the forecast revenue from the ledger. No second formula needed.
A KPI formula can contain any mix of ledger rows and dataset rows, and any number of each. A formula with four ledger rows and two dataset rows is evaluated as one expression — the builder shows the full formula string as you add rows so you can verify the arithmetic before saving.
First-Time Activation Checklist
- Open Operational Data in the BrizoConsol sidebar. If you do not see it, confirm your subscription includes the feature and that you have management access to the organisation.
- Click New dataset. Enter a clear name — something that will be recognisable in a dashboard card six months from now.
- Set the number of dimensions and give each one a label that matches the column header in your source spreadsheet exactly (or close enough that the auto-mapper will guess correctly). If multiple entities in your group will each upload their own version of this dataset, use the exact same dataset name and dimension labels across all of them — BrizoConsol uses this to recognise them as the same kind of data and automatically create a consolidated group block for the dashboard.
- Choose the account setting: start with “No account link” if you are not sure; you can change it later from the Edit dialog.
- Choose the scenario setting. If every row in this dataset will always be the same scenario (for example, Actuals only), select “One scenario for the whole dataset” and pick Actual. If your source file contains actuals for closed months and a forecast for future months in the same export, select “Scenario column in the uploaded file” and make sure your CSV has a column labelled Scenario.
- Choose the currency translation mode. For headcount, units or any non-monetary metric, select “No translation”. For monetary values uploaded by subsidiaries in their own currency, select “Average rate” for P&L-type measures or “Closing rate” for balance-sheet-type values. Leave as “No translation” if you are on a single-entity setup.
- Save the definition, then click Download template and fill it in with a small number of real rows — enough to test that the column mapping works.
- Drag the test file into the upload zone. Check the auto-mapped columns, leave the replace mode as “Replace periods covered by this file”, and click Import.
- Review the import summary: confirm the row count and check for any skipped periods, unmatched accounts, or unrecognised scenario values.
- Open your dashboard, click the block picker, and find the new dataset block. Add it to a section and confirm the data looks correct for the period you uploaded.
- To build a KPI that uses this dataset, open the KPI builder and add a dataset row. Pick the dataset, optionally pin a dimension value, and choose Movement or Balance as the basis. Combine it with a ledger row (for a financial-to-operational ratio) or another dataset row (for an operational-to-operational ratio).
- If you linked an account, open the dataset detail screen and expand the Validation panel to review the month-by-month comparison against the ledger.
- Repeat the upload each month with the period-scoped replace mode. Only the new month’s rows are affected; everything else stays in place.
Ready to connect your operational data to your consolidation?
Book a walkthrough and we will set up your first dataset live on your own data. See It In Action