Why Your Group Budget vs Actual Dashboard Never Looks Right — And How to Fix It
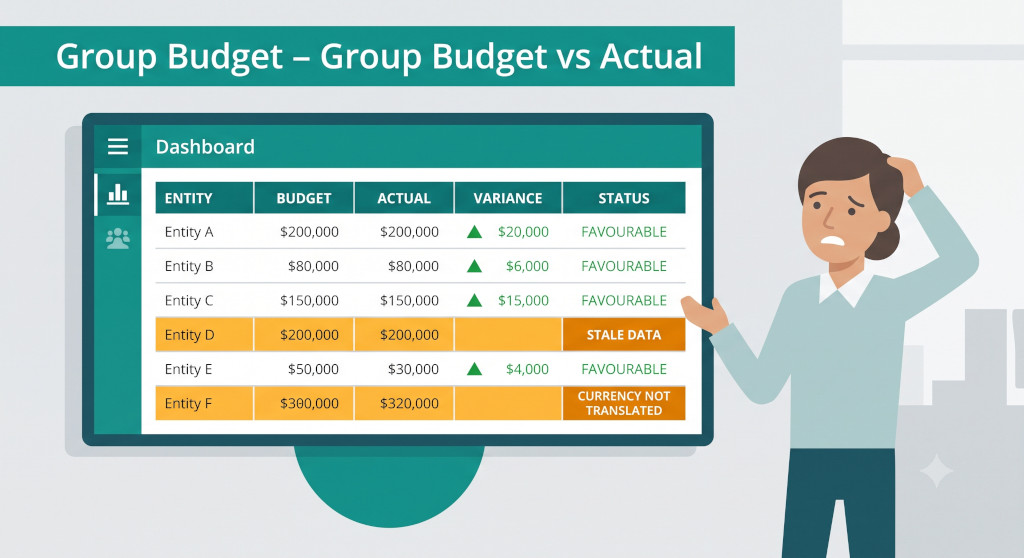
Marcus is the CFO of a six-entity professional services group. Every month, his board asks the same question: “How are we tracking against budget?” And every month, Marcus finds himself saying some version of “the numbers aren’t quite ready yet” or “there’s a currency issue I need to sort out.” He has been trying to build a consolidated budget vs actual dashboard for the better part of a year. The problem is not that he lacks data. Every entity files a budget at the start of the year and closes its books each month. The problem is that the budget and the actuals never line up cleanly enough to show the board a number he is confident in.
Three things are wrong at once. The six entities submitted their budgets in four different formats, using different line items and different levels of granularity. Two of the entities operate in GBP and SGD, but the budget figures were never translated into the group’s AUD reporting currency — so the variance for those entities is partly performance and partly exchange rate movement, and Marcus can’t tell which is which. And one entity is consistently three weeks behind on actuals, so every time the dashboard is run, the group P&L is mixing this month’s results for the fast closers with last month’s results for the laggard.
Each of these problems is solvable on its own. Together, they make the consolidated budget vs actual view unreliable enough that the board has stopped trusting the dashboard and started asking for the raw spreadsheets instead — which defeats the purpose of having a dashboard at all.
Stop building consolidations in spreadsheets.
BrizoConsol automates multi-entity consolidation — setup in minutes, reports the same day.
Why Group Budget vs Actual Is Harder Than Entity-Level Budget vs Actual
At the entity level, budget vs actual is a manageable problem. One accounting system, one chart of accounts, one currency. You set the budget at the start of the year, run the actuals at month end, and the variance is the difference. Most accounting software — Xero, MYOB, QuickBooks, Zoho Books — handles this adequately within a single company file.
At the group level, four complications appear that don’t exist in a single-entity context, and they interact with each other in ways that compound the unreliability of the output.
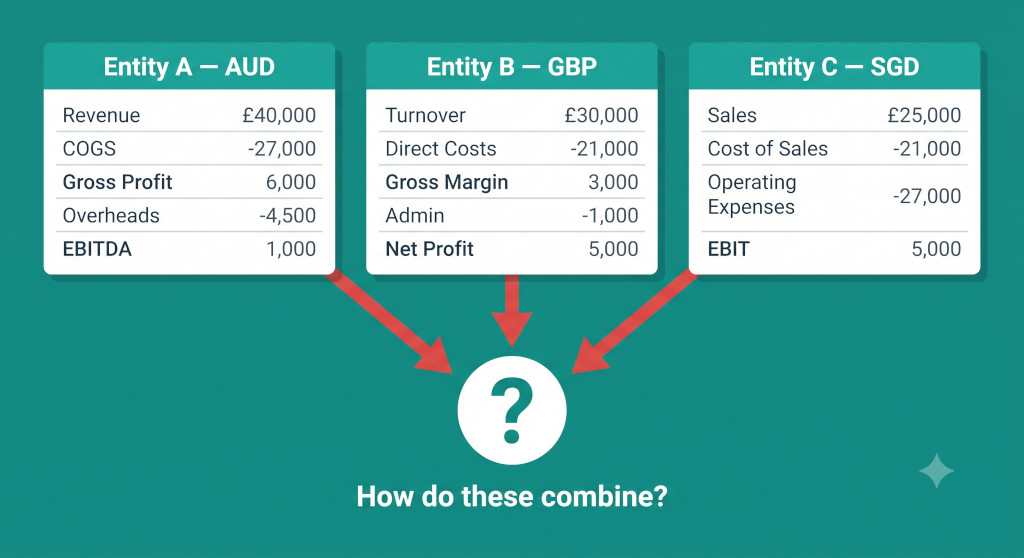
The first is structural inconsistency across entity budgets. When six finance managers each build their own budget in their own format, the resulting line items don’t map neatly to a common group chart of accounts. One entity’s “Gross Margin” is another’s “Net Revenue after Direct Costs.” One entity budgets depreciation inside “Overheads”; another shows it as a separate line. When you try to roll these up into a group P&L, you’re either forcing unlike things to add together, or you’re losing granularity by collapsing everything into broad summary lines that don’t tell the board anything useful. For a practical guide to solving the chart of accounts problem at its root, see our post on how to design a common chart of accounts for multi-entity groups.
The second is currency translation applied inconsistently — or not at all — to budget figures. The third is timing: entities that close at different speeds create a consolidated view that mixes periods. The fourth is budget version control: entities that quietly revise their budgets mid-year without telling the group finance team, so the “budget” in the dashboard is no longer what anyone actually agreed to.
Marcus is dealing with all four simultaneously, which is why his dashboard keeps failing. Let’s work through each one and its fix.
Problem 1 — Entity Budgets Are Structured Differently and Won’t Roll Up Cleanly
This is the foundational problem, and it must be solved before any of the others. If the budget line items don’t map to a common group structure, every number in the consolidated budget vs actual view is a guess.
The practical fix is a group budget template: a standardised format, distributed to every entity at the start of the budget cycle, that aligns to the group’s consolidated chart of accounts. Every entity completes the same template, using the same line items in the same order, at the same level of granularity. Finance managers may need to reclassify some of their existing budget lines to fit the template — that reclassification is the work that makes the group view possible.
| Common Failure | What Goes Wrong | Fix |
|---|---|---|
| Entity uses “Turnover” — group uses “Revenue” | Budget line doesn’t map; manual reclassification needed every month | Group template specifies “Revenue” as the required label |
| Entity budgets depreciation inside “Overheads” | Group EBITDA is understated vs budget; EBITDA variance is inflated | Template separates depreciation as a standalone line below EBITDA |
| Entity budgets by quarter, not by month | Monthly budget vs actual impossible; dashboard shows blank budget for 2 of every 3 months | Template requires monthly phasing — entity can apply a simple split rule if needed |
| Entity includes intercompany revenue in budget | Consolidated budget is overstated; variance looks better than it is | Template instructs entities to exclude intercompany lines from budget submission |
The group budget template is not a complex document. It is a pre-formatted spreadsheet — or, ideally, a structured input in the consolidation platform — that imposes consistent structure at the point of data entry rather than requiring reconciliation after the fact.
The group budget template should be issued before the budget cycle opens, not retrofitted after entities have already built their numbers. Asking a finance manager to reformat a completed budget into a new structure is three times more work than having them build into the template from the start — and the reclassification errors in a retrofit are significantly higher.
Problem 2 — Budget Figures Aren’t Translated at the Right Exchange Rate
This is the most technically damaging problem in Marcus’s dashboard, and it’s also the one most often misunderstood. When an entity budgets in GBP and the group reports in AUD, the budget figures need to be translated into AUD. The question is: which exchange rate do you use?
The instinctive answer — translate at the current closing rate — is wrong, and it will create phantom variances every single month.
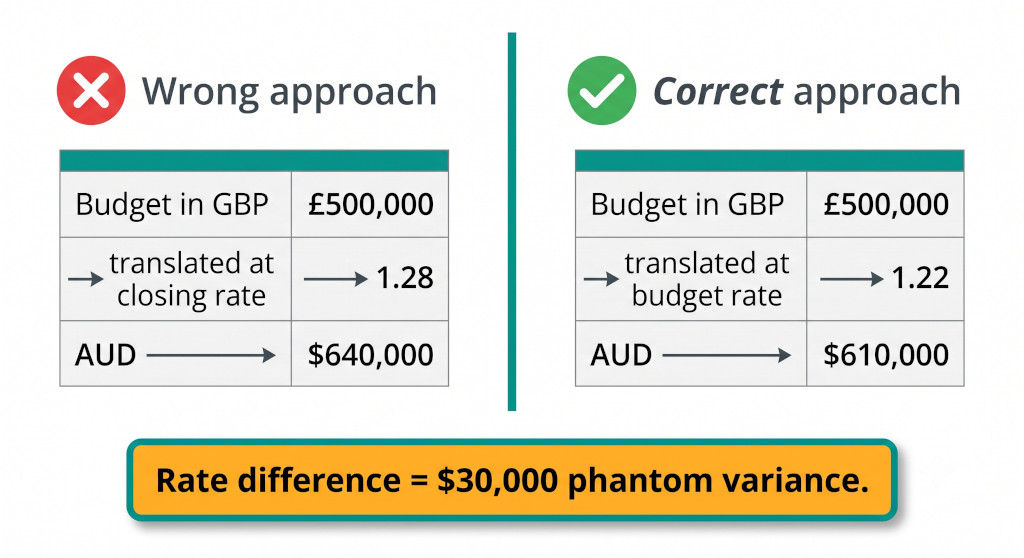
Here’s why. Suppose the GBP entity budgeted revenue of £500,000. At the time of budgeting (say, January), the GBP/AUD rate was 1.22, so the budget in group currency was AUD $610,000. By June, the rate has moved to 1.28. If you translate the budget at the June closing rate, the budget becomes AUD $640,000. The entity delivers exactly £500,000 in revenue — precisely on budget in its own currency — but the dashboard shows a $30,000 unfavourable variance. That variance is entirely a currency movement, not a performance issue, but it looks like an underperformance problem to anyone reading the numbers.
Why the exchange rate choice changes the variance — GBP entity, June close
Entity budget (set in January): £500,000
Entity actuals (June): £500,000 (exactly on budget)
Approach A — translate budget at June closing rate (1.28):
Budget in AUD: $640,000
Actuals in AUD (at closing rate 1.28): $640,000
Variance: $0 ← appears fine
Approach B — translate budget at budget rate (1.22), actuals at closing rate (1.28):
Budget in AUD: $610,000
Actuals in AUD (at closing rate 1.28): $640,000
Variance: +$30,000 favourable ← but this is currency movement, not performance
The correct approach is to freeze the budget exchange rate at the rate used when the budget was set — typically the rate at the start of the budget year or the rate agreed at budget sign-off — and hold that rate constant throughout the year for all budget comparisons. Actuals continue to be translated at the closing rate (per IAS 21, ASC 830, or FRS 102 as applicable). The resulting variance reflects genuine performance against plan, with currency movements shown separately as a reconciling item rather than buried inside the operational variance.
For a detailed explanation of how currency translation works across accounting standards, see our guide to currency translation under IAS 21, ASC 830, and FRS 102.
The frozen budget rate must be documented. When the rate is frozen at budget sign-off, record the rate for each currency pair and store it alongside the budget data. If the rate is held only in someone’s memory or a note in an email, it will be wrong by February when the person who remembers it is on leave and someone else reruns the dashboard.
Problem 3 — The Dashboard Mixes Actuals From Different Periods
Marcus’s third problem — one entity consistently three weeks behind — creates a consolidated view that is not a single snapshot. It is a hybrid: four entities showing June actuals, one entity showing May actuals because it hasn’t closed yet. The June consolidated budget vs actual is not a June number. It is an approximation, and the approximation is different every month depending on how late the laggard is.
There are two ways to handle this, and they have very different implications for what the dashboard communicates.
The first approach is to hold the dashboard until every entity has closed. This produces a clean, accurate figure — but it means the board sees June results in late July, by which point the numbers are of limited operational value. If one entity is reliably slow, this approach punishes the timeliness of the entire group.
The second approach is to run the dashboard with available actuals and show explicitly which entities are included and which are not. The dashboard presents the group figure alongside a coverage note: “June actuals: 5 of 6 entities closed. Entity F: May actuals used.” The board can see the figure and understand its scope. This is more transparent than a false precision that hides the incomplete close.
The underlying fix is a tighter close discipline. If one entity is consistently late, the root cause is usually one of three things: the entity’s accounting software doesn’t produce a clean trial balance without manual intervention, the entity has intercompany transactions that can’t be confirmed without waiting for the other party, or the entity’s finance resource is insufficient for the close cycle expected of it. Each of these has a different solution, but all of them are operational problems, not dashboard problems. The dashboard is just where the lateness becomes visible. Our multi-entity month-end close checklist provides a structured framework for tightening the close across all entities.
See what a clean group budget vs actual view looks like
BrizoConsol connects actuals from your accounting systems, holds your budget data in a structured format, and produces a consolidated budget vs actual view with frozen currency rates and clear entity coverage — every month.See It In Action
Problem 4 — Budget Versions Keep Changing Mid-Year
The fourth problem is the most politically awkward: an entity updates its budget mid-year without telling the group finance team, and the version in the dashboard is no longer what anyone agreed to. This is more common than most CFOs realise. A subsidiary GM asks their accountant to “update the budget to reflect the new headcount” in March, the accountant revises the budget file, and the group dashboard quietly starts comparing actuals against a different baseline from April onwards. Nobody notices until a particularly large favourable variance prompts a question in the board meeting and it emerges that the budget line had been revised down by 15%.
The fix is version locking. Once the budget is submitted to the group and accepted for the consolidated dashboard, that version is frozen. Changes to entity budgets — whether for operational reasons or updated assumptions — must go through a formal reforecast process that is presented to the board as a revised baseline, not silently updated in the underlying data. The group finance team controls the budget data in the dashboard; entity finance teams control their own local planning files.
This discipline requires the budget data to live somewhere the group controls — not in a spreadsheet stored on the entity’s finance manager’s laptop. Whether that is a shared consolidation platform, a controlled folder in the group’s file system, or a structured submission process, the key is that the group finance team is the custodian of the budget data used in group reporting.
How to Structure a Group Budget vs Actual Dashboard That Works
Once the four underlying data problems are resolved, the dashboard itself can be relatively simple. The most effective group budget vs actual dashboards for multi-entity groups follow a layered structure: summary at the top, entity drill-down below, and currency reconciliation available on demand.
The summary layer shows the group P&L — revenue, gross profit, EBITDA, and net profit — with budget, actuals, and variance for the current month and year to date. This is what the board sees first. The numbers should be translatable to a single page of the board pack without further explanation. For what else belongs in a board-level financial presentation, see our guide on what a group monthly management report should include.
The entity layer shows the same P&L structure broken down by entity, with each entity’s figures in the group reporting currency. This is where finance directors investigate the drivers behind the summary variance. An entity showing a 20% favourable revenue variance needs to be looked at — it might be genuine outperformance, or it might be a budget that was set too low, or it might be a currency movement that was not properly isolated.
The currency reconciliation layer — available on request rather than on the face of the dashboard — shows for each foreign-currency entity the variance split: how much of the total variance is performance (actuals vs budget at the same frozen rate) and how much is currency (the movement in the closing rate since the budget was set). Without this layer, a multi-currency group cannot honestly tell its board whether a variance is something management did or something the foreign exchange market did.
| Dashboard Layer | Audience | Contents | Frequency |
|---|---|---|---|
| Group summary | Board / CEO | Revenue, GP, EBITDA, Net Profit — BvA current month and YTD | Monthly |
| Entity breakdown | CFO / Finance Director | Same P&L by entity in group currency — highlights large variances | Monthly |
| Currency reconciliation | CFO / Group Controller | Performance variance vs currency variance by entity | Monthly (on request) |
| Budget version log | Group Finance Team | Budget submission dates, version numbers, reforecast history | Maintained continuously |
The dashboard does not need to be elaborate. What it needs to be is trustworthy. A board that questions the numbers every month will eventually stop looking at the dashboard and ask for raw data instead — as Marcus’s board has done. The goal is a consolidated budget vs actual view clean enough that the first question in the board meeting is “what are we going to do about the variance in Entity D?” rather than “are these numbers right?”
For more on how group financial dashboards should be designed to drive action rather than confusion, see How Finance Teams Should Use Dashboards (And What to Avoid) and Why Your Multi-Entity Group Still Doesn’t Have a Real Dashboard.
Pre-Dashboard Checklist: Six Things to Confirm Before Publishing the Numbers
- Template consistency verified. Confirm that all entity budgets were submitted using the group template. Any entity that submitted in a non-standard format should have its figures reclassified before the data enters the dashboard.
- Budget exchange rates documented and frozen. For each foreign-currency entity, confirm that the exchange rate used to translate budget figures is the rate agreed at budget sign-off — not the current closing rate. Record the frozen rate in a reference table that travels with the budget data.
- Actuals coverage confirmed. List which entities have closed for the current period and which have not. If any entity is using prior-period actuals as a proxy, flag this explicitly in the dashboard rather than presenting a blended figure as if it were a complete close.
- Budget version locked. Confirm that the budget data in the dashboard matches the version accepted at the group level. Any reforecasts since the original submission should be documented and presented separately, not substituted silently for the original baseline.
- Intercompany budget lines excluded. Confirm that no entity has included intercompany revenue, intercompany recharges, or intra-group dividends in its budget submission. These would inflate the consolidated budget and produce a systematic favourable variance on those lines regardless of actual performance.
- Currency reconciliation prepared. For any foreign-currency entity showing a variance larger than a materiality threshold, prepare the performance vs currency split before the dashboard is presented. The CFO should not be surprised by a “what’s driving this?” question in the board meeting that requires a rerun of the numbers.
These six checks take less time to run than a single board meeting spent defending numbers that turn out to be wrong. Embedding them as a formal pre-publish step — part of the same close discipline that governs actuals — is what separates a dashboard the board trusts from one they’ve learned to treat with scepticism.
If you are currently maintaining the budget data in a spreadsheet alongside the actuals, the structural fragility of that approach — separate files, manual translation, no version control — is likely the root cause of at least two of the four problems described above. Our guide on how to master variance analysis across entities covers the tooling and process decisions that make the consolidated view reliable at scale.
Build a group budget vs actual dashboard your board will trust
BrizoConsol holds budget data in a structured, version-controlled format, applies frozen exchange rates automatically, and surfaces a consolidated budget vs actual view across all your entities — without the spreadsheet maintenance. Start Free Trial