Group Cash Position Dashboard: How Multi-Entity Groups Monitor Cash Across All Entities
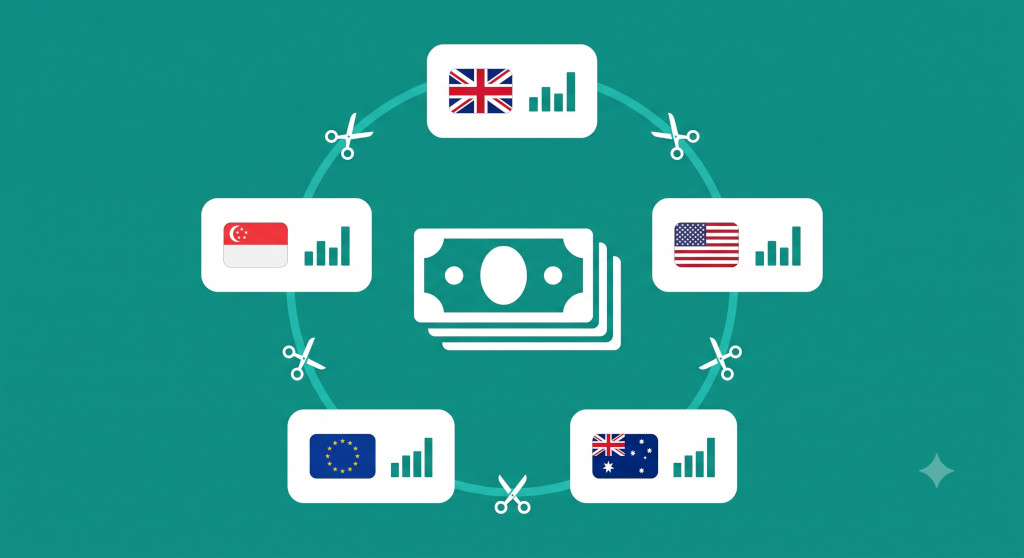
When the CFO of a six-entity professional services group asked his group controller for the current cash position, the answer came back in four minutes: £2.3m across the group, with the breakdown by entity. It was a well-run finance function. The controller had direct access to all six Xero accounts and could pull the bank balances quickly.
The problem surfaced three weeks later, when the group needed to move cash to cover a supplier payment at the holding company. The holding company’s own balance was £180,000 — not the £420,000 the weekly summary had shown. The discrepancy was explained eventually: £240,000 of the “holding company cash” was sitting in a current account that received intercompany recharges from the subsidiaries, but had already been committed to settling an intercompany loan repayment due that month. The consolidated figure had looked healthy. The available figure was not.
This is the cash monitoring problem in multi-entity groups, and it is more common than most finance teams acknowledge. The sum of entity bank balances is not the group’s cash position. It is a starting point — one that requires three specific adjustments before it becomes a number the CFO can rely on to make decisions. Getting those adjustments right, and making them visible in a dashboard rather than a weekly email, is what a group cash position dashboard is built to do.
Stop building consolidations in spreadsheets.
BrizoConsol automates multi-entity consolidation — setup in minutes, reports the same day.
The Three Reasons Your Entity Cash Totals Are Wrong
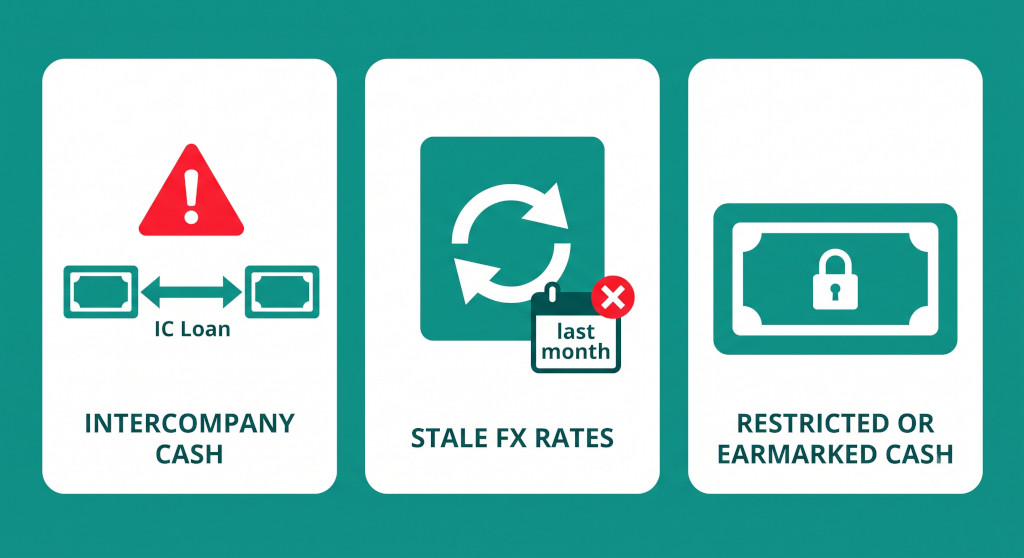
1. Intercompany cash inflates the group total
The most significant distortion in multi-entity cash reporting is intercompany loans and cash balances. When Entity A lends £300,000 to Entity B, the consolidated cash position of the group does not change — cash has moved from one pocket to another. But at the entity level, Entity A shows £300,000 less cash and Entity B shows £300,000 more. If you add the two entity balances together, the £300,000 appears in full in Entity B’s total and the reduction in Entity A has already been counted. The net effect on the sum of balances is zero — which is correct, but only because two offsetting distortions cancel each other out. The individual entity balances are each wrong in isolation.
The more serious problem arises when one entity’s cash balance includes amounts that are due to be repaid to a sister company in the short term. Entity B’s £300,000 balance looks like available cash, but if the loan is repayable in 30 days, it is not freely available — it is committed. A consolidated cash dashboard that eliminates intercompany loans from both the asset and liability side makes this visible. The entity-level total does not.
For a detailed treatment of how intercompany balances work and why they often fail to match, see our guide to intercompany reconciliation for multi-entity groups and the companion post on why intercompany balances never match even when both companies agree.
2. Multi-currency conversion at stale rates
In a group with foreign currency entities, every entity’s cash balance needs to be translated into the group’s reporting currency before a consolidated total is meaningful. The rate used for that translation matters. A group with an Australian subsidiary holding AUD 800,000 in cash will show a different GBP equivalent depending on whether the translation uses today’s rate, last month’s closing rate, or the average rate for the current period.
In a weekly cash summary built manually, finance teams typically use whatever rate is to hand — often a spot rate looked up that morning, or the rate from the previous month’s close. When the AUD/GBP rate has moved 3% since last month’s close, the GBP equivalent of AUD 800,000 shifts by approximately £13,000. That is a rounding error for some groups and a material difference for others. More importantly, it means the weekly cash figure is not directly comparable to last week’s figure — the change in cash might be partly a cash movement and partly an exchange rate movement, and the summary cannot tell you which.
A group cash dashboard connected to the consolidation engine uses the same translation methodology as the group accounts — closing rate for balance sheet items, applied consistently — so that changes in the reported cash position reflect actual cash movements rather than rate fluctuations.
3. Restricted and committed cash is not free cash
The third distortion is the hardest to automate: cash that is technically on the balance sheet but is not available to the group for general purposes. This includes cash held against specific contracts or client deposits, cash in entities that have legal or regulatory restrictions on distribution, and cash that has been committed to near-term payments (loan repayments, tax payments, lease deposits) but not yet disbursed.
A group cash dashboard should distinguish between total cash and available cash. The difference is not always large, but when it is large it is usually the number the CFO most needs to know. In the example at the start of this post, the holding company’s apparent £420,000 cash position was largely committed — a distinction that the entity bank balance did not make visible.
Common mistake: Reporting total cash on the group dashboard without flagging the proportion that is intercompany, restricted, or committed in the near term. The CFO sees £2.3m and assumes it is available. The controller knows £800,000 of it is not. That gap in understanding leads to poor decisions.
A Worked Example: Building the Correct Group Cash Position
The table below illustrates how a six-entity group moves from entity bank balances to a correct consolidated cash position. The group has entities in the UK (GBP), Australia (AUD), and Singapore (SGD).
| Entity | Currency | Bank Balance | GBP Equivalent (rate) | Intercompany Cash Held | Net External Cash |
|---|---|---|---|---|---|
| HoldCo UK | GBP | £520,000 | £520,000 | £240,000 (loan from Sub A) | £280,000 |
| Sub A (UK) | GBP | £310,000 | £310,000 | — | £310,000 |
| Sub B (UK) | GBP | £185,000 | £185,000 | £80,000 (loan from HoldCo) | £105,000 |
| Sub C (Australia) | AUD | AUD 860,000 | £447,000 (0.52) | — | £447,000 |
| Sub D (Singapore) | SGD | SGD 420,000 | £238,000 (0.566) | £60,000 (loan from HoldCo) | £178,000 |
| Sub E (UK) | GBP | £95,000 | £95,000 | — | £95,000 |
| Sum of entity balances (naïve total) | £1,795,000 | ||||
| Consolidated external cash position | £1,415,000 | ||||
Sum of entity GBP equivalents ……………… £1,795,000
Less: HoldCo intercompany cash held …………. (£240,000)
Less: Sub B intercompany cash held ………….. (£80,000)
Less: Sub D intercompany cash held ………….. (£60,000)
Consolidated external cash position ………….. £1,415,000
The naive entity total overstates freely available group cash by £380,000 — a 27% difference. A CFO reading the entity summary and making a dividend decision, a debt repayment decision, or a capital expenditure decision based on £1,795,000 is working from a materially incorrect number. The consolidated figure of £1,415,000 is what the group actually has access to from external sources.
See your consolidated cash position — eliminations included
Connect your entities and see a group cash view that has already removed intercompany balances and applied consistent currency translation. No manual adjustment required.See It In Action
What to Show at the Group Level vs Entity Level
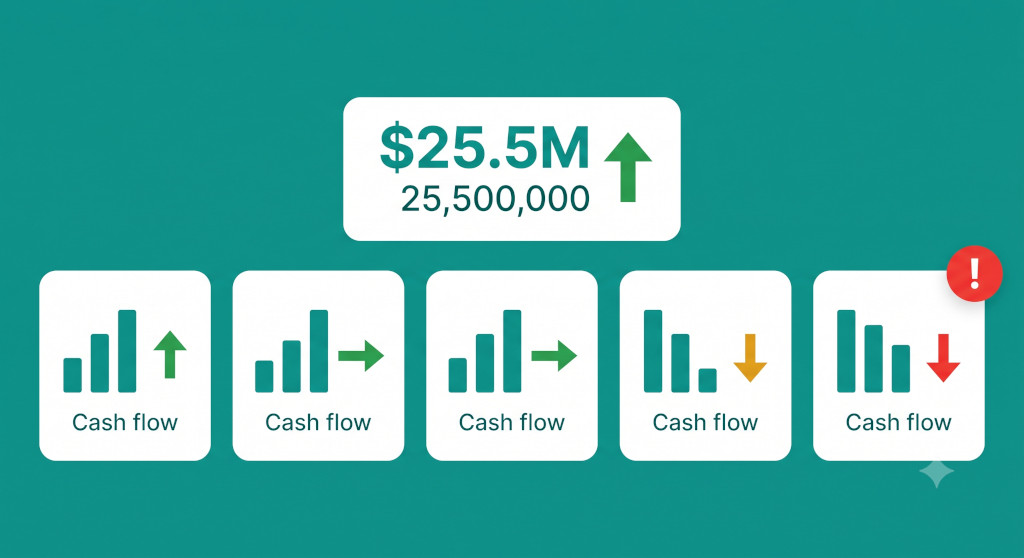
A group cash position dashboard needs two layers. The group layer answers the CFO’s question: how much cash does the group have and is it safe? The entity layer answers the controller’s question: which entity’s cash position is moving in a direction that needs attention?
At the group level, the dashboard should show consolidated external cash (with intercompany eliminated), the change from the prior period in the group’s reporting currency, and a directional signal — is group cash growing, stable, or declining? These three data points answer the CFO’s cash question in under thirty seconds. Everything else belongs at the entity level or in a management report.
At the entity level, the dashboard shows each entity’s cash position alongside a health signal. BrizoConsol’s Pulse Health Scores apply this principle across the group: each entity is scored on its cash trajectory, so the controller can see at a glance whether Sub D’s declining cash balance is an isolated movement or a developing trend. The group total might look fine while one entity is quietly running short — the entity-level health score surfaces that before it becomes a group-level problem.
The specific signals worth tracking at entity level for cash monitoring are: cash balance versus the same period last month, days of operating cost cover (cash divided by average monthly operating costs), and whether the entity has any intercompany receivables that are overdue — since these represent cash that should have arrived but has not. Our post on group KPI reporting for multi-entity businesses covers the full range of entity-level metrics worth tracking alongside cash.
The Currency Translation Question
In a multi-currency group, the group cash position dashboard must apply a consistent translation methodology. The choice is not complicated, but it needs to be explicit: use the closing rate as at the dashboard date for all foreign currency balances. This is consistent with how cash appears in the consolidated balance sheet under all major accounting standards, and it means the dashboard figure will tie to the group accounts rather than diverging from them.
The implication is that the group cash figure will change between periods for two separate reasons: actual cash movements within each entity, and exchange rate movements on foreign currency balances. A well-designed dashboard separates these two effects, at least at a summary level. Showing “cash movement this month: +£42,000 of which +£29,000 operating and +£13,000 FX” gives the CFO a cleaner picture than a single net movement figure that blends the two. For the accounting framework behind this, our guide to currency translation under IAS 21, ASC 830, and FRS 102 explains how different standards treat exchange differences on cash.
Connecting the Cash Dashboard to the Close Cycle
The most useful version of a group cash position dashboard is one that updates as each entity submits its data at month-end close, rather than appearing as a single snapshot on a fixed date. This means the group controller can see the cash picture building through the close process — three entities submitted, three to go — and can identify whether a late-submitting entity is likely to materially change the group position once its data arrives.
This requires the dashboard to be connected to the consolidation system rather than built as a separate reporting layer. When cash data from each entity flows into the consolidation engine — where intercompany eliminations are applied automatically — the dashboard reflects the current state of the close rather than a frozen snapshot. The CFO does not need to wait for the full close to be complete before getting a directional view of the group cash position. They see it updating in real time as entities submit.
For the broader framework of how the month-end close connects to group reporting, our guide to what a group monthly management report should include covers what the cash section of that report should contain once the close is complete.
Building a Group Cash Position Dashboard: A Checklist
- List every intercompany cash balance in the group. Before building the dashboard, map all intercompany loans, current account balances, and recharge receivables between entities. These are the items that must be eliminated from the entity totals before the group cash figure is meaningful. If these are not already reconciled regularly, fix the reconciliation process first — a dashboard built on unreconciled intercompany balances will show a different number every time someone looks at it. See our complete guide to intercompany eliminations for the full treatment.
- Define your translation rate policy. Decide which rate to use for foreign currency cash balances — typically closing rate as at the reporting date — and document it. Apply the same rate consistently so that period-on-period comparisons are clean. The rate used on the dashboard should be the same rate used in the consolidated accounts.
- Identify restricted and committed cash by entity. For each entity, list any cash that is not freely available: client deposits held in trust, cash committed against near-term loan repayments, cash in entities with distribution restrictions. Flag these in the dashboard or show them as a separate line below the headline group total.
- Set up the two-layer view. Build a group-level view (three metrics: consolidated external cash, period change, directional signal) and an entity-level view (each entity’s cash balance with a health score and trend indicator). Keep these as distinct views rather than combining them into a single crowded panel.
- Connect the dashboard to the consolidation output. The dashboard must pull from consolidated data — with eliminations applied — not from entity accounting software directly. If the consolidation runs in a dedicated tool, the dashboard should be downstream of that tool, not built as a parallel process. Our guide to how finance teams should structure dashboards covers the architectural principle behind this.
- Review the dashboard output against the consolidated balance sheet each month-end. The cash figure on the dashboard should reconcile to the cash line in the consolidated balance sheet at close. If it does not, the elimination methodology or the translation rate is inconsistent between the two. Fix the reconciliation before using the dashboard as a decision-making tool.
Back at the six-entity professional services group, the CFO’s team rebuilt their cash monitoring after the payment near-miss. The new dashboard showed consolidated external cash — intercompany loans excluded — alongside entity-level cash trajectories and a flag for any entity with less than six weeks of operating cost cover. The first time the CFO saw Entity D drop below that threshold, he asked about it before month-end rather than discovering it three weeks after the fact. That is what a group cash position dashboard is supposed to do: surface the signal before it becomes a problem.
Start your free trial — consolidated cash view included
BrizoConsol connects your entities, applies intercompany eliminations automatically, and gives you a consolidated cash position that ties to your group accounts. No manual adjustment spreadsheet required. Start Free Trial