NCI, CTA, and JV/Associate Reports: Audit-Ready Consolidation Workings Now Built Into BrizoConsol
Audit season for group accounts has a predictable shape. The auditors ask for the consolidation workpapers. The group controller produces a set of spreadsheets. The auditors ask how the NCI was calculated. The controller explains the formula. The auditors ask where the CTA came from. The controller pulls up a different tab. The auditors ask why the CTA differs from last month. The process takes days, not hours — not because the numbers are wrong, but because the workings are spread across files, emails, and memory.
BrizoConsol has added three new reports that replace this process with a single, structured, exportable output for each of the three most commonly questioned consolidation adjustments: the NCI Report, the CTA Report, and the JV/Associate Report. Each report shows not just the number, but the formula used to arrive at it, the source period the data was drawn from, and the posting account the adjustment feeds into. The output is auditable by design.
The NCI Report — Every Component, Every Formula
The NCI Report answers the question that auditors and audit committee members ask every year: how exactly was the non-controlling interest calculated, and what drove the movement since the prior period?
Automate NCI calculations across all your entities.
BrizoConsol handles non-controlling interest automatically — no manual adjustments required.
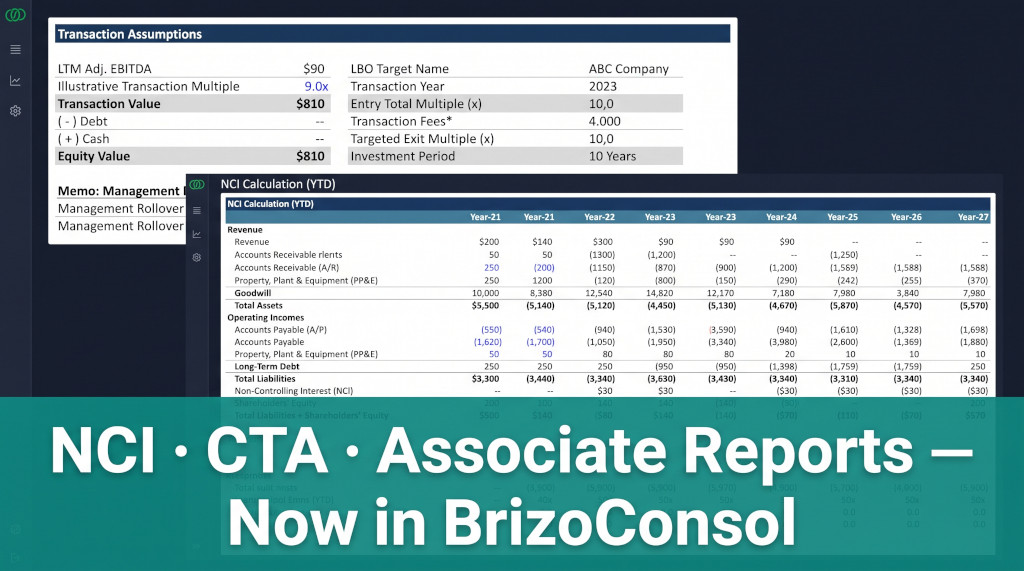
The report is organised into two sections. The first — Transaction Assumptions — displays the ownership parameters for the selected entity: the parent entity, the acquisition date, the transaction type, the percentage acquired, the investment cost, the fair value of net assets at acquisition, and the resulting goodwill or gain. These are the fixed parameters that anchor all downstream NCI calculations.
Transaction Assumptions
Acquisition date, percentage acquired, investment cost, fair-value net assets, goodwill — the fixed parameters that govern all NCI calculations for this entity.
NCI Calculation (YTD / MTD)
Every NCI component with its formula, source period, base amount, NCI percentage, calculated amount, and posting account — all in one scrollable table.
The second section — NCI Calculation — is the substance of the report. Each row in the calculation table represents a distinct NCI component. The columns show exactly how BrizoConsol arrived at each figure:
| Column | What it shows |
|---|---|
| Component | What the adjustment represents — NCI Share of Profit, NCI Share of CTA, Acquisition Equity Elimination, Acquisition FV Adjustment, NCI Net Assets, Goodwill, etc. |
| Source Period | The period from which the underlying data is drawn — e.g. Jan 2026 – Jul 2026, or “Acquisition” for one-time entries. |
| Formula | The precise calculation rule — for example, pni_movement × NCI% × average_fx (segmented by ownership period) for the NCI share of profit, or equity_balance at acquisition date × closing_fx for acquisition equity eliminations. |
| Base | The input value before applying the NCI percentage — the full 100% figure from which the NCI share is calculated. |
| NCI % | The ownership percentage applied — either the NCI share percentage (e.g. 20%) or 100% for entries that are not split. |
| Amount | The calculated NCI amount that posts to the consolidation. |
| Posting Account | The specific consolidation account the entry feeds — Share Capital, Retained Earnings, NCI – Share of Profit, Goodwill, Investment in Subsidiary, and so on. |
This level of transparency resolves the most common NCI audit question in a single document. When an auditor asks “why is the NCI Share of Profit £17,526 this year?”, the NCI Report shows that it was calculated as the subsidiary’s P&L movement of £87,633 multiplied by the 20% NCI percentage, translated at the average exchange rate for the period. There is no need to reconstruct the calculation from spreadsheets.
Acquisition entries in the same view
The NCI Report also captures the one-time acquisition entries alongside the period entries — the equity eliminations at acquisition date (share capital, retained earnings, revaluation reserve, hedging reserve, FVOCI reserve), the fair value adjustment, the investment in subsidiary debit, the funding credit to bank, and the opening NCI net assets. Every journal entry that established the subsidiary in the consolidation on day one is visible in the same report as the current-period NCI movement. For groups working through a post-acquisition consolidation in Year 2 and beyond, having the acquisition entries permanently visible alongside the current-period entries makes the year-on-year reconciliation straightforward.
The CTA Report — Rates, Formulas, and Every Translation Component
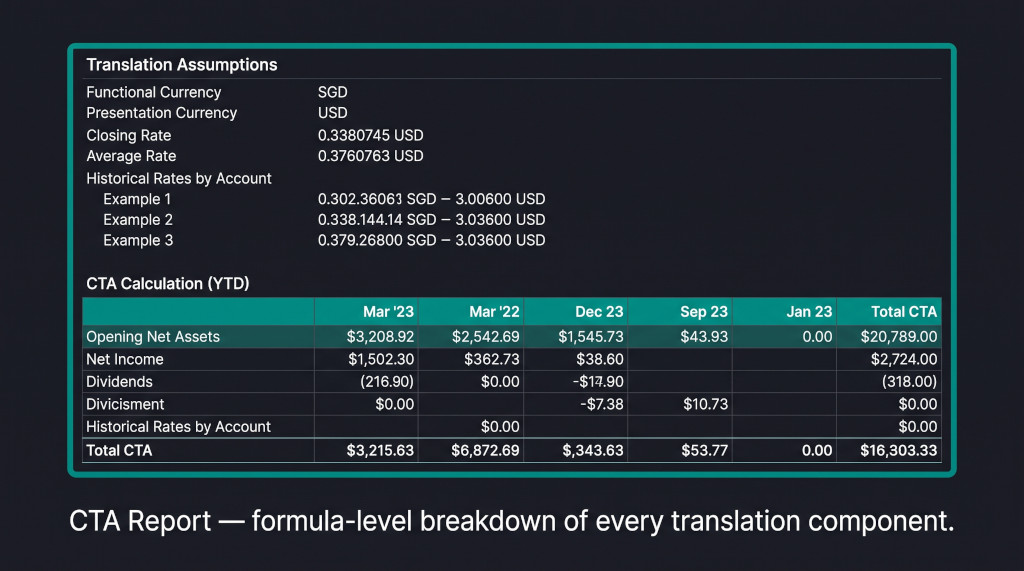
The CTA Report — closing rate, average rate, historical rates by account, and a formula-level breakdown of each CTA component.
The currency translation adjustment is the consolidation item that finance teams most often struggle to explain. The total CTA for a period is a net figure — it moves with exchange rates in ways that can look arbitrary without the underlying breakdown. The CTA Report makes that breakdown visible.
The Translation Assumptions section at the top of the report documents every rate used for the selected entity and period:
Functional & Presentation Currency
Confirms which currencies are involved — e.g. SGD functional, USD presentation — so there is no ambiguity about which direction the translation runs.
Closing Rate & Average Rate
The two primary translation rates for the period, shown explicitly. Any rate input error is immediately visible here rather than buried in a calculation.
Historical Rates by Account
The historical exchange rate applied to each equity account — Share Capital, Share Premium, Revaluation Reserve, Hedging Reserve, FVOCI Reserve — documented account by account.
The CTA Calculation table then shows each component of the total CTA with its formula:
Non-P&L Equity Translation (e.g. Share Capital)
(Local balance ÷ closing rate) − (Local balance ÷ historical rate)
Retained Earnings CTA
Closing translation − historical translation + fiscal carryCurrent Year Earnings CTA
Monthly P&L translated at average rates − YTD P&L at closing rateEach component posts to a specific account — Share Capital CTA to G-3000 Share Capital, Retained Earnings CTA to G-3100 Retained Earnings, and the Current Year Earnings CTA to G-3200 Translation Reserve. The total CTA is the sum of all components and represents the movement in the FCTR for the period.
For a detailed explanation of why these components arise and how they accumulate year on year, see the post on foreign subsidiary consolidation and the IAS 21 closing rate method. The CTA Report is the live, data-driven version of those mechanics applied to your actual entity figures.
The practical benefit for audit is significant. An auditor reviewing the FCTR movement can see immediately that the Current Year Earnings CTA of −£3,085 arose because the monthly average rate (1.3365) differed from the closing rate (1.34) — the formula is shown in the table, the rates are documented in the assumptions section, and the posting account is specified. The number is fully traceable without leaving the report.
The JV/Associate Report — Equity Method Share of Profit, Period by Period
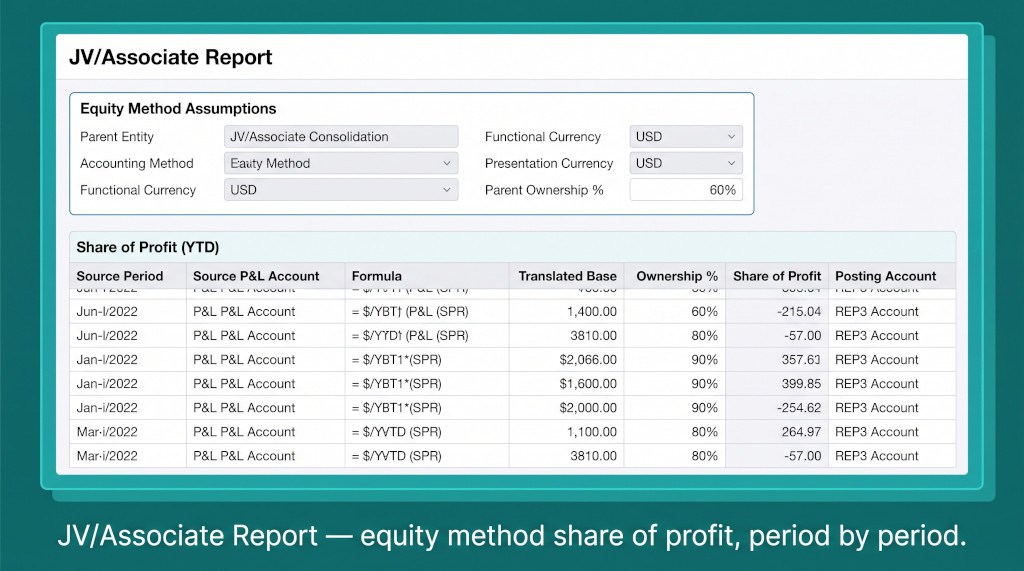
The JV/Associate Report — equity method assumptions and the period-by-period share of profit calculation for each associate or joint venture.
Associates and joint ventures are accounted for under the equity method in the consolidated accounts — the group recognises its share of the associate’s profit or loss each period rather than consolidating line by line. The JV/Associate Report shows how that share of profit was calculated for each period, from which P&L accounts it was derived, and where it posts in the group accounts.
The Equity Method Assumptions section confirms the accounting method in use, the effective date from which it applies, the parent’s ownership percentage, and the functional and presentation currencies involved. For groups that have recently lost control of a former subsidiary and retained a 25% associate stake, the assumptions section shows the transition point clearly.
The Share of Profit table breaks down the equity-accounted income by source period and source P&L account. The columns show:
| Column | What it shows |
|---|---|
| Source Period | The period from which the associate’s P&L data was drawn — aligned with the associate’s own reporting calendar if different from the group’s. |
| Source P&L Account | The specific P&L account in the associate’s own chart of accounts from which the income or loss originated. |
| Formula | How the share of profit was translated and calculated — including the exchange rate applied where the associate has a different functional currency. |
| Translated Base | The associate’s total P&L movement in the group’s presentation currency before applying the ownership percentage. |
| Ownership % | The group’s equity stake — the percentage that determines the share of profit recognised. |
| Share of Profit | The amount posted to the consolidated income statement. |
| Posting Account | The group-level account the share of profit credits — typically “Share of profit of associates.” |
For groups with multiple associates or a step acquisition that started as an equity-accounted associate before control was gained, the report maintains a clear historical record of the equity-accounted period — useful both for audit and for the disposal gain calculation if the associate is subsequently sold.
Export to PDF and Excel
PDF Export — for audit packs and board packsAll three reports export to PDF with a single click. The PDF preserves the assumptions section, the full calculation table, and the column structure — formatted for inclusion in audit files, board packs, or lender reporting packs without reformatting.
Excel Export — for further analysis and reconciliationThe Excel export preserves the tabular structure of each report with all columns intact. The data can be used directly for reconciliation, variance analysis between periods, or input into external reporting templates.
Both export formats are available for the NCI Report, CTA Report, and JV/Associate Report. The reports can be run for any period — YTD or MTD — and for any entity in the group, making it straightforward to produce entity-specific workpapers for each subsidiary within a single consolidation run.
YTD and MTD Views — Switching Between Period Bases
Each report supports both year-to-date (YTD) and month-to-date (MTD) views, selectable from the filter bar alongside the entity, scenario, and period selectors. The YTD view is the primary audit basis — it shows the accumulated position from the start of the financial year to the selected period. The MTD view shows only the movement in the selected month, which is useful for identifying what drove a change in a specific period without the cumulative noise of prior months.
For the CTA Report, the YTD and MTD views are particularly useful when a rate movement in a single month has had a disproportionate effect on the FCTR — the MTD view isolates that month’s components, while the YTD view shows the net accumulated position.
See the reports running on your own data
Connect your entities to BrizoConsol and the NCI, CTA, and JV/Associate reports populate automatically — no spreadsheet maintenance, no manual formula upkeep. Export to PDF or Excel in one click. See It In Action Start Free Trial